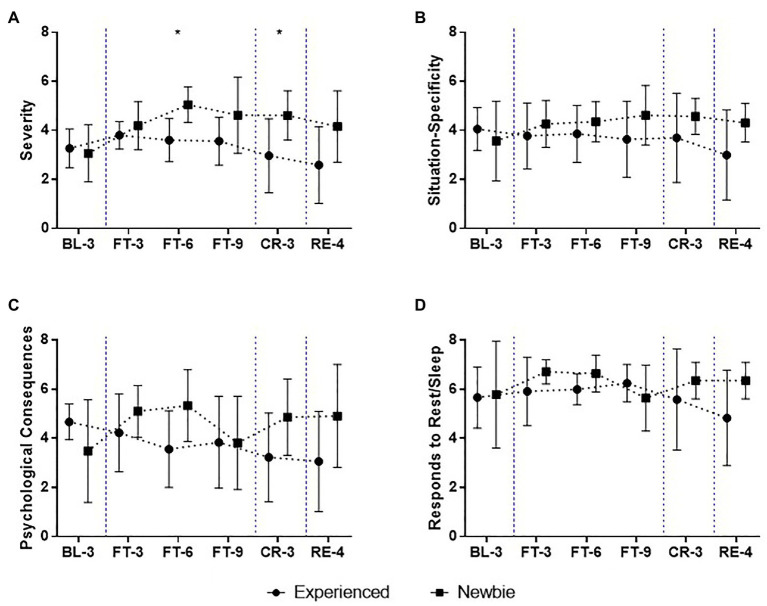
Figure 5.
Mean and SD of fatigue scores over the 22-day experiment for the Experienced and Newbie groups. (A-D) The scores of the subscales of the fatigue assessment instrument (FAI). Symbols represent mean scores for the two groups, and error bars represent the SD of the mean. *p < 0.05 indicates significant differences between the two groups at a given test point. Blue dashed lines indicate the different sessions.

