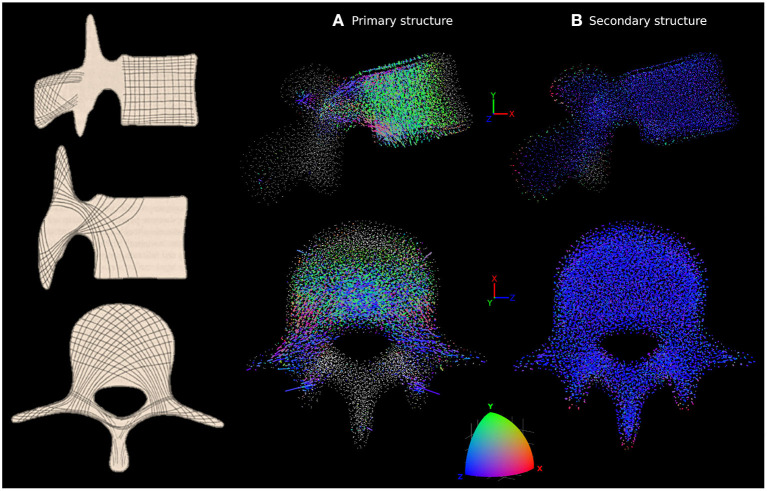
Figure 5.
Characterisation of anisotropy in the trabecular bone of L4 adapted to the healthy scenario. In-vivo observations by Gallois and Japiot (1925) are shown on the left. (A) Shows the orientation of the trabecular trusses of the primary structure (with a radius larger than 0.1 mm). (B) Shows the orientation of the trabecular trusses of the secondary structure (with a radius of 0.1 mm). For (A,B), side view (top row) and top view (bottom row) are shown. Lines are attached to each trabecular node, with colour and length varying respectively with the orientations and radii of the truss elements connected to that particular node. The colour scale at the bottom shows how the colour of the lines should be interpreted. Orientation along the X, Y, or Z axes are in red, green, or blue, respectively. Any orientation that is not colinear with these axes shows as a combination of red, green and blue. A white dot indicates a node without elements in the size range being looked at connected to it.

