Figure 9.

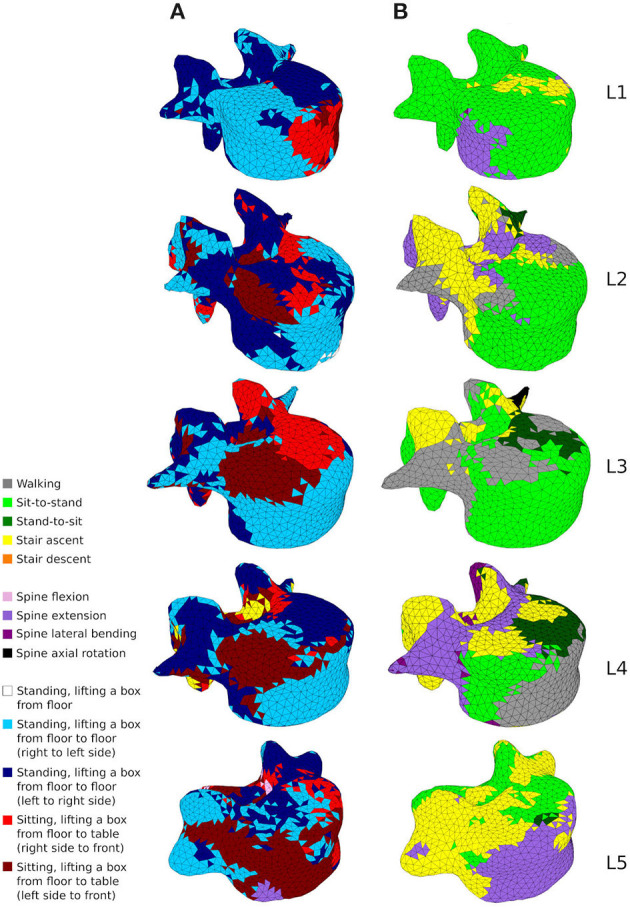
A map showing which activity gives rise to the highest absolute maximum principal strain for the adaptation of the cortical shell elements in the healthy scenario (A) and the sedentary scenario (B).

A map showing which activity gives rise to the highest absolute maximum principal strain for the adaptation of the cortical shell elements in the healthy scenario (A) and the sedentary scenario (B).