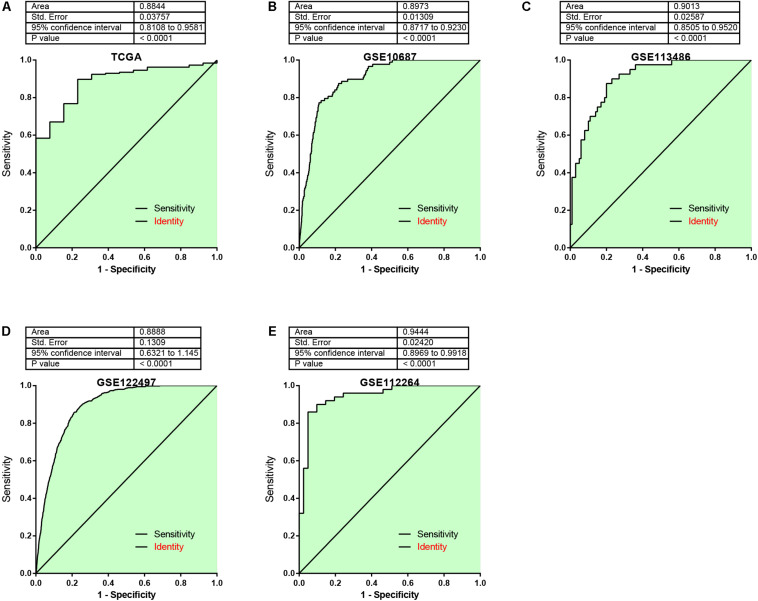
FIGURE 6.
The AUC analysis of the risk signature for distinguishing EC from normal samples was analyzed. (A–E) ROC curve analyses for the risk signature were 0.8844, 0.897, 0.9013, 0.888, and 0.9444 by analyzing TCGA (A), GSE106817 (B), GSE113486 (C), GSE122497 (D), and GSE112264 (E) cohorts, respectively.

