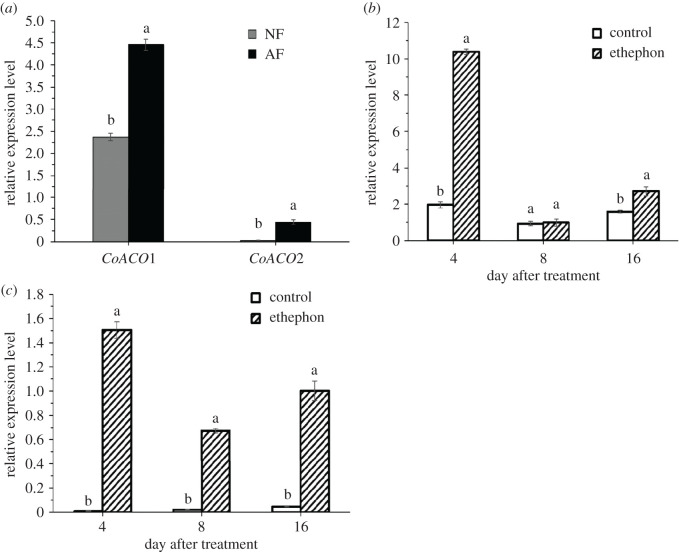
Figure 6.
Relative expression levels of CoACO genes in FAZs of C. oleifera ‘Huashuo’ by qRT-PCR. (a) qRT-PCR analysis of CoACO1 and CoACO2 genes, respectively, in AZs of NF and AF. (b,c) qRT-PCR analysis of CoACO1 and CoACO2 genes in FAZs after the treatment of ethephon with respect to the control. Three biological replicates for each sample were averaged. Error bars indicate the s.d. of the means (n = 3). One-way ANOVA (Duncan's multiple range test) analysis was performed, and statistically significant differences (p < 0.05) were indicated by different letters.

