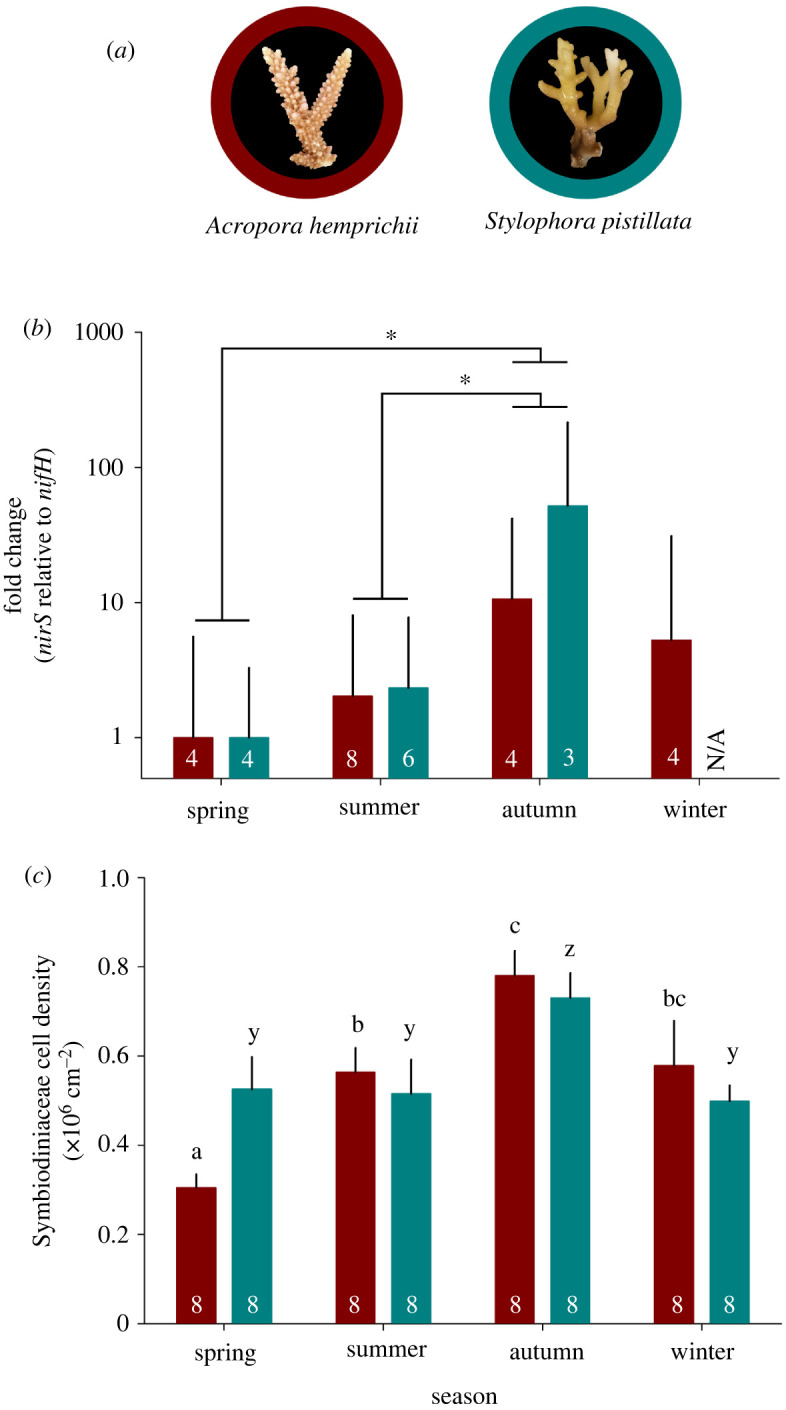
Figure 1.

Patterns of nirS to nifH gene abundance ratios and Symbiodiniaceae cell densities associated with two central Red Sea hard coral species across four seasons. (a) Representative photographs of investigated species, (b) fold change of nirS to nifH gene abundance ratios and (c) Symbiodiniaceae cell densities. Fold changes were calculated in relation to spring, during which both species exhibited the lowest nirS to nifH gene abundance ratios; bars indicate the mean; error bars indicate upper confidence intervals (+1 s.e.). Numbers in the bars represent the sample size (n). Within plot (b), asterisks indicate significant differences between seasons (pair-wise PERMANOVA, *p < 0.05). Within plot (c), different letters above error bars indicate statistically significant differences per species between seasons (pair-wise PERMANOVA, p < 0.05). N/A = not available.
