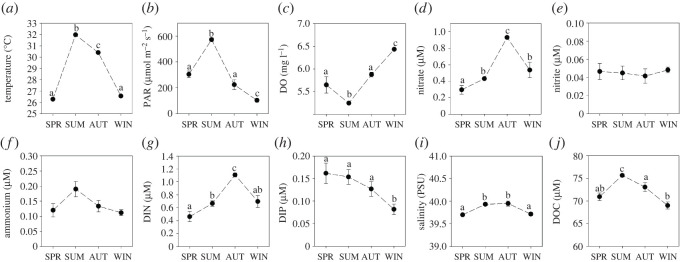
Figure 2.
Means (±s.e.) of environmental parameters measured over four seasons. (a) Temperature, (b) PAR, (c) DO, (d) nitrate, (e) nitrite, (f) ammonium, (g) dissolved inorganic nitrogen (DIN = [nitrate] + [nitrite] + [ammonium]), (h) dissolved inorganic phosphorus (DIP = [phosphate]), (i) salinity and (j) DOC. Different letters above error bars indicate significant differences between seasons within each plot (p < 0.05). SPR = spring; SUM = summer; AUT = autumn; WIN = winter. Data were extracted from Roth et al. [14,36] and re-analysed for the purpose of this study.

