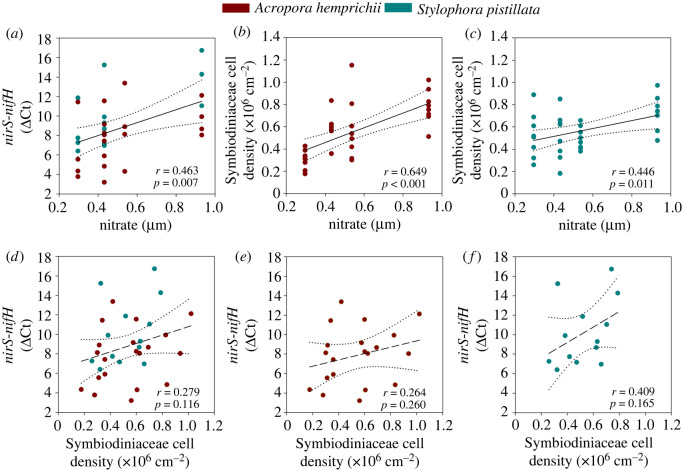
Figure 3.
Pearson product-moment correlation analyses for (a) ΔCt of nirS-nifH against environmental nitrate concentrations pooled for both coral species, cell densities of Symbiodiniaceae against environmental nitrate concentrations for (b) A. hemprichii and (c) S. pistillata and linear regression analyses for (d) ΔCt of nirS-nifH against cell densities of Symbiodiniaceae pooled for both coral species, for (e) A. hemprichii and (f) S. pistillata. r = Pearson coefficient. Best-fit linear regression lines ± 95% confidence intervals (dotted lines) are solid when a significant relationship was established; lines are dashed when not significant.

