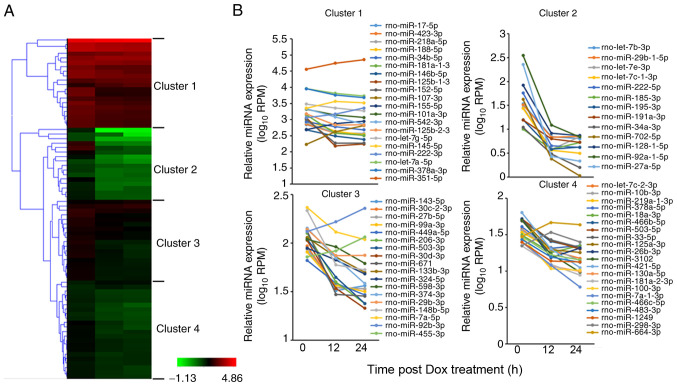
Figure 2.
Dynamics of miRNAs in H9c2 cells during Dox treatment. Cluster analysis of miRNAs with altered miRNA expression, determined using high-throughput sequencing, were analyzed at 0, 12 and 24 h after Dox treatment. (A) A total of 76 differentially expressed miRNAs (RPM >10) were identified, whose expression levels changed ≥1.5-fold compared with the 0-h time point. The miRNA RPM values were normalized with log10-transformation before using cluster analysis. The 76 miRNAs were classified into 4 clusters (clusters 1–4) using the Hierarchical Clustering Explorer v3.5 software. (B) Dynamic miRNA expression curves for each cluster. miR/miRNA, microRNA; RPM, reads per million; Dox, doxorubicin.

