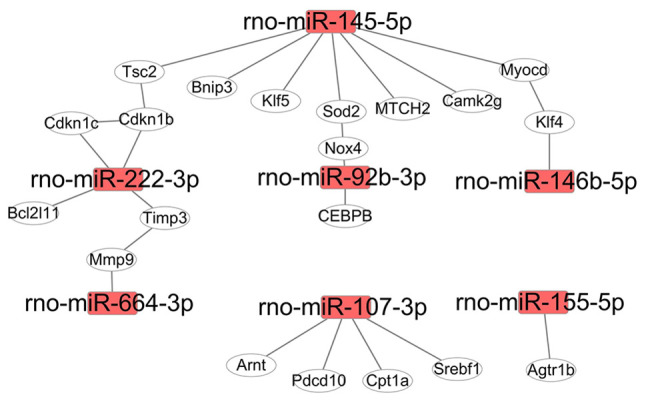
Figure 4.

Interaction network of targeted genes downstream of upregulated miRNAs. A total of 7 miRNAs and their targets were included in the interaction network. The interaction network was visualized using the Cytoscape software. Rectangle nodes denote miRNAs, and oval nodes denote genes. miR/miRNA, microRNA.
