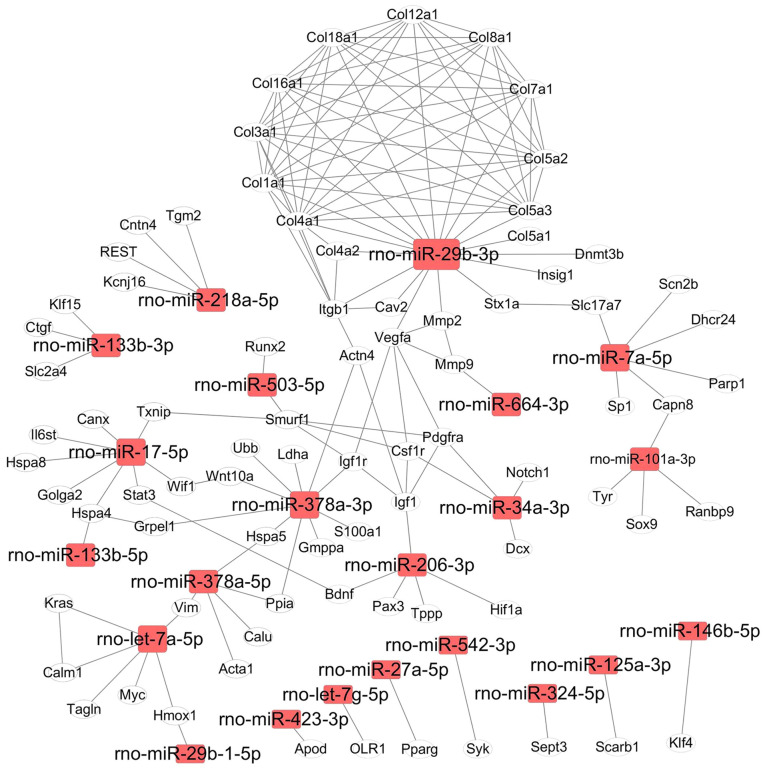
Figure 5.
Interaction networks of targeted genes downstream of downregulated miRNAs. A total of 22 miRNAs and their targets were included in the interaction network. The interaction network was visualized using the Cytoscape software. Rectangle nodes denote miRNAs, and oval nodes denote genes. miR/miRNA, microRNA.

