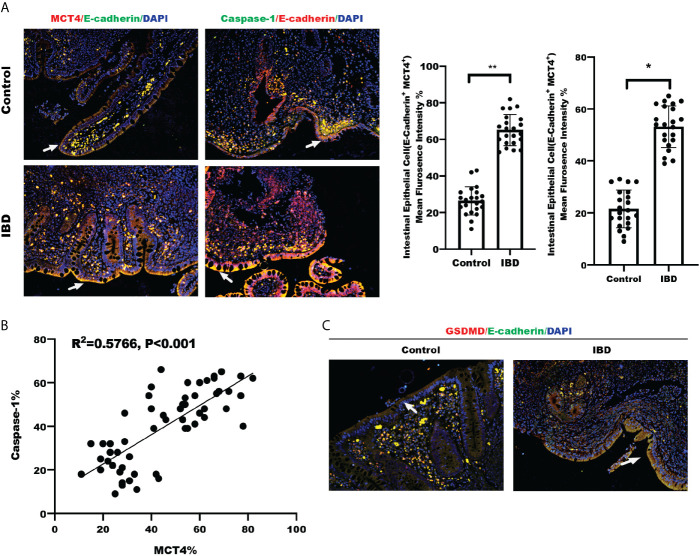
Figure 4.
Clinical relationship between MCT4 and Caspase-1. (A) Immunofluorescence of MCT4 and Caspase-1 expression in intestinal epithelial cells labeled E-cadherin in Control group (n = 24) and IBD group (n = 24), respectively; the relative immunofluorescence intensity of MCT4+E-Cadherin+ and Caspase-1+E-Cadherin+ in intestinal epithelial cells was quantified by Image J and analyzed by t test. Data represented the mean ± s.d., **p < 0.01, *p < 0.05. (B) Clinical correlation between MCT4 and Caspase-1 expression was generated and analyzed by simple linear regression. (C) IF of GSDMD expression in intestinal epithelial cells labeled E-cadherin in Control group (n = 24) and IBD group (n = 24).

