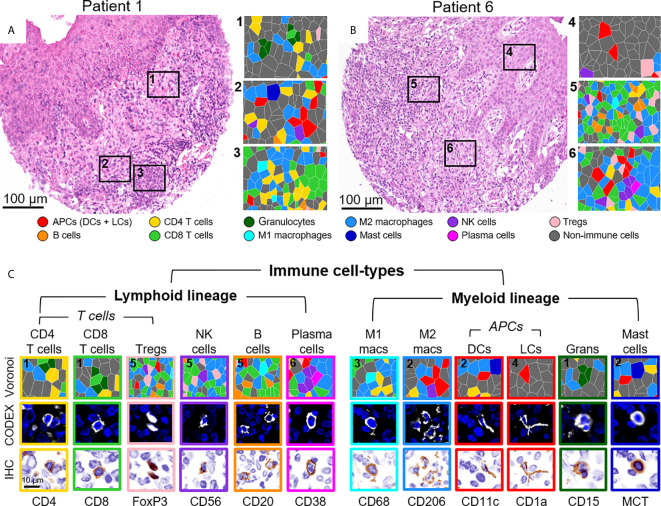
Figure 3.
Visualizing immune cell-types by CODEX. (A, B) H&E stainings for two different CTCL patients and corresponding Voronoi diagrams from 6 select regions; see Figure 2B for full Voronoi diagram. (C) Major immune cell-types separated by lineage and shown as: 1) a zoomed-in region from one the six selected Voronoi diagrams, color-coded as in (A, B) (top panel), 2) a CODEX fluorescent image with Hoechst nuclear stain (blue) and the marker of interest (white) (middle panel), and 3) a simulated brightfield IHC image for the marker of interest (bottom panel). Scale bars: (A, B) 100 µm, (C) 10 µm.

