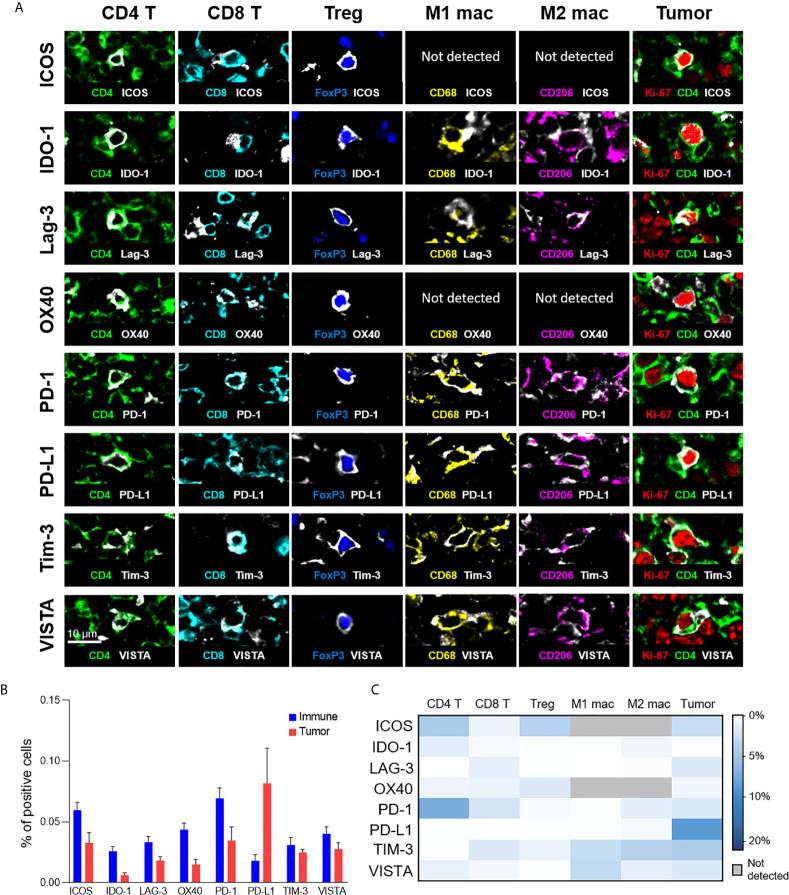
Figure 4.
Expression of immunoregulatory proteins on different cell-types. (A) Color overlays of immune (CD4 – green; CD8 – cyan; FoxP3 – blue; CD68 – yellow; CD206 – magenta), tumor (Ki-67 – red; CD4 – green), and immunoregulatory proteins (ICOS, IDO-1, LAG-3, OX40, PD-1, PD-L1, TIM-3, VISTA – white). (B) Percentage of immune (T cells and macrophages) and tumor cells expressing immunoregulatory proteins; mean and standard error across patients. (C) Heatmap showing the mean percentage of immunoregulatory protein expression for the different T cell, macrophage, and tumor cell populations.

