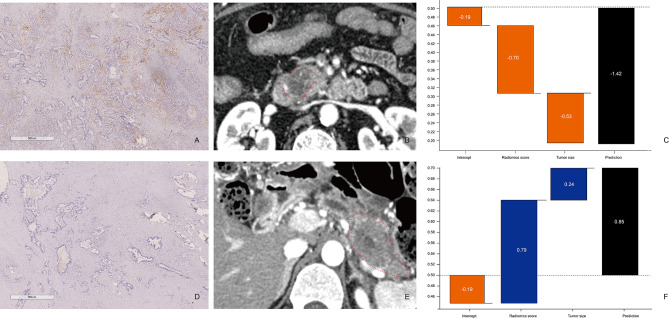
Figure 4.
Comparison between patients with low and high CD8+ T-cell infiltration (A–C) Patient 1: A 65-year-old man with PDAC in the CD8+ T-high group. (A) CD8+ T-cell infiltration is high (×20). (B) The axial portal-phase CT image shows an infiltrative, low-attenuation mass (arrows) located at the pancreatic head. (C) The prediction probability of low CD8+ T infiltration was 80.58% by XGBoost classifier. (D–F) Patient 2: A case of a 49-year-old man with PDAC in the CD8+ T-low group. (D) CD8+ T-cell infiltration is low (×20). (E) The axial portal-phase CT image shows an infiltrative, low-attenuation mass (arrows) located at the pancreatic body and tail. (F) The prediction probability of low CD8+ T-cell infiltration is 70.07% by XGBoost classifier.

