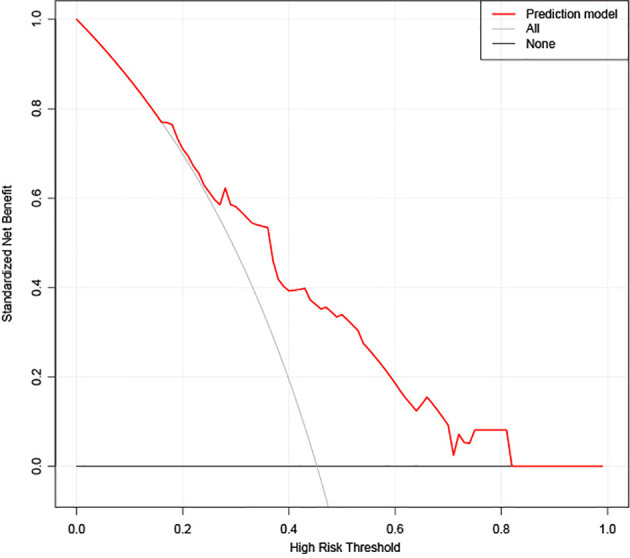
Figure 6.

Decision curve analysis (DCA) for the extreme gradient boosting (XGBoost) classifier. The y-axis represents the net benefit. The gray line represents the hypothesis that all patients had high CD8+ T-cell infiltration. The black line shows the hypothesis that all patients had low CD8+ T-cell infiltration. The x-axis shows the threshold probability, which is where the expected benefit of treatment is equal to the expected benefit of avoiding treatment. The decision curves show that with a threshold probability greater than 0.16, using the prediction model to predict CD8+ T-cell infiltration adds more benefit than the treat-all-patients as high CD8+ T-cell infiltration scheme or the treat-none as low CD8+ T-cell infiltration scheme in the training set.
