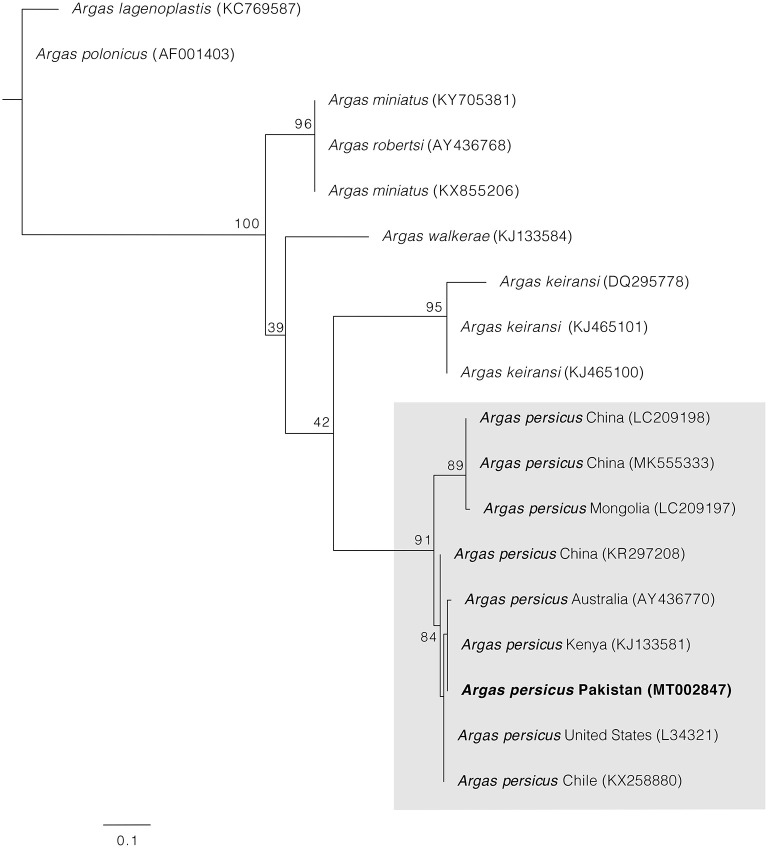
Figure 5.
Maximum likelihood tree constructed for the 16S sequence of A. persicus generate in this study. Species names are followed by country and accession numbers in parentheses. Bootstrapping values (1,000) are shown at each node. The bar represents 0.1 substitutions per site. Sequence obtained in the present study is highlighted in bold.

