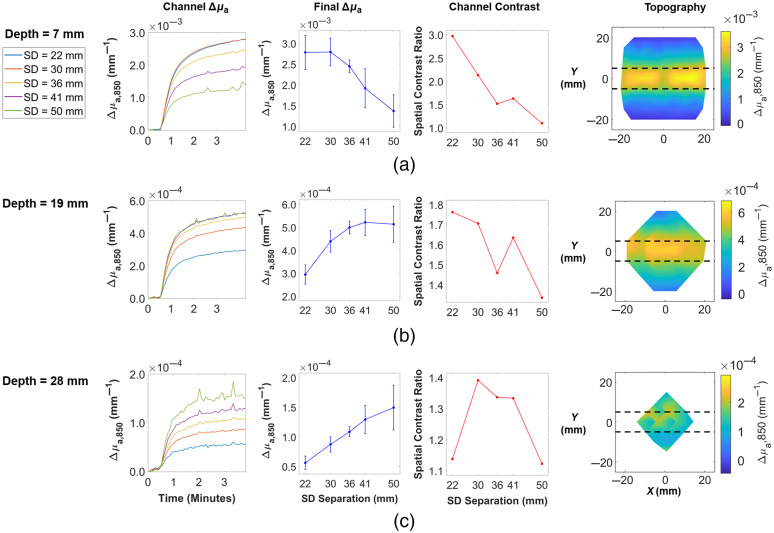
Fig. 4.
Results from flow phantom experiments for channels whose upper edge were (a) 7 mm, (b) 19 mm, and (c) 28 mm below the background phantom surface. Only 850 nm data are shown. The first column, labeled “Channel ,” depicts the mean values as a function of time across all S-D pairs that probe the width of the channel. Flow began after . For each S-D separation (going from 22 to 50 mm), the sample sizes (number of S-D pairs within channel) were as follows: , 12, 20, 20, 18. The second column, labeled “Final ,” shows the mean and standard deviation of channel values at the final time point of the flow experiment. The third column, labeled “Channel Contrast,” depicts spatial contrast as a function of S-D separation. The final column shows a topographic reconstruction of the final values (in space) for each channel depth, each shown for the S-D separation that corresponded to the highest final . For panel (a), this was 22 mm; for panel (b), this was 41 mm; and for panel (c), this was 50 mm. The colorbar represents in units of , and the horizontal dashed lines indicate the true boundaries of the channel (Video 1, mp4, 420 KB [URL: https://doi.org/10.1117/1.JBO.26.6.062708.1]; Video 2, mp4, 500 KB [URL: https://doi.org/10.1117/1.JBO.26.6.062708.2], Video 3, mp4, 457 KB [URL: https://doi.org/10.1117/1.JBO.26.6.062708.3]).

