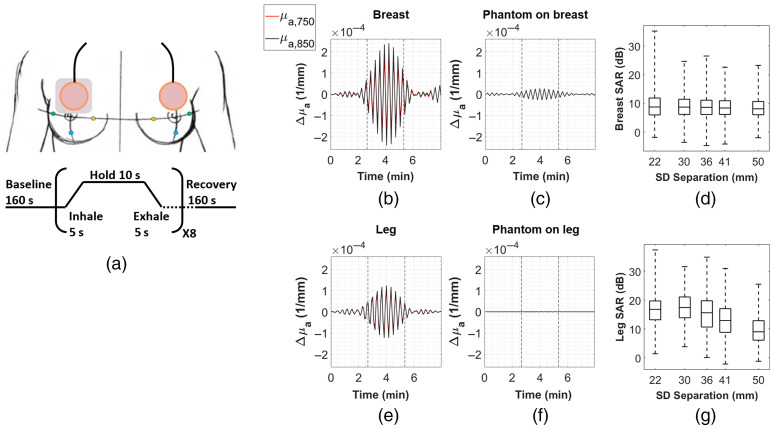
Fig. 7.
(a) Paced breathing protocol. The gray rectangle between the probe and right breast represents the worn phantom. (b) Representative example of band-pass filtered mean time traces from a right breast measurement for 750 nm (red) and 850 nm (black) at 22-mm S-D separation. Each time trace is the mean across S-D pairs. The vertical dashed lines indicate the start and end of paced breathing at 0.05 Hz. (c) The time traces for the 22-mm S-D separation for the contralateral worn phantom on breast measurement. (d) Boxplots showing the distribution of SAR values across all S-D pairs and trials for the breast measurements, grouped by S-D separation. The horizontal line inside the boxplots indicates the median, and the edges of the box indicate the 25th and 75th percentiles. Whiskers extend to the minimum and maximum values. For breast SARs, total number of S-D pairs from to that met the QC criteria (and thus are included in this figure) are as follows: , 620, 804, 616, 418. (e) Representative example of band-pass filtered mean time traces from a right leg measurement at 22-mm S-D separation. (f) The time traces for the contralateral worn phantom on leg measurement. (g) Same boxplots as in (d), but for leg SARs. The total number of S-D pairs are: , 482, 616, 420, 248.

