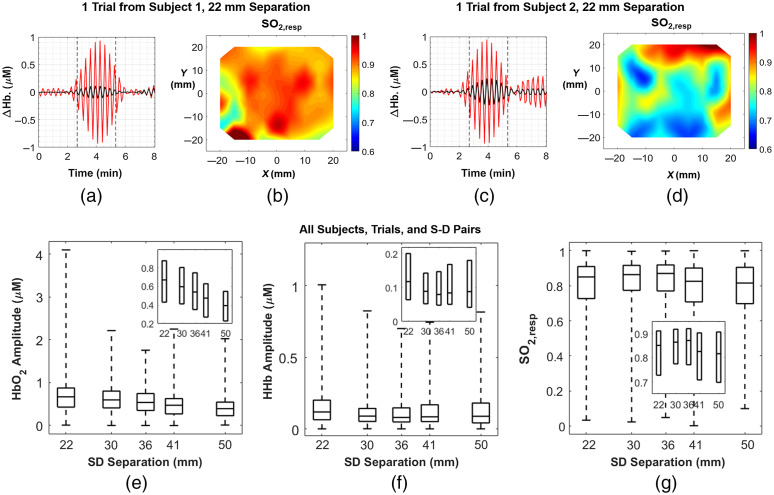
Fig. 8.
(a) Band-pass filtered mean time traces of (black) and (red) for a right breast measurement from a healthy volunteer. Each time trace is the mean value across all 72 channels that have a 22-mm S-D separation. Paced breathing at 0.05 Hz occurred between dashed lines, whereas normal breathing was performed before the first dashed line and after the second. (b) The corresponding topographic map at 22-mm S-D separation for this trial. (c) The same visualization presented in (a) for a different subject’s left breast. (d) The same visualization presented in (b) for the subject in (c). (e) Distribution of amplitudes across all S-D pairs and trials, presented in boxplots. Number of measurement points from to are as follows: , 309, 388, 303, and 191. (f) Distribution of amplitudes across all S-D pairs and trials. Number of measurement points are as follows: , 273, 344, 260, and 164. (g) Distribution of values across all S-D pairs and trials. Number of measurement points are as follows: , 272, 330, 255, 146. The horizontal line inside the boxplots indicates the median, and the edges of the box indicate the 25th and 75th percentiles. Whiskers extend to the minimum and maximum values. The insets show zoomed-in version on the boxes without the whiskers to better visualize relationships between hemodynamic metrics and S-D separation.

