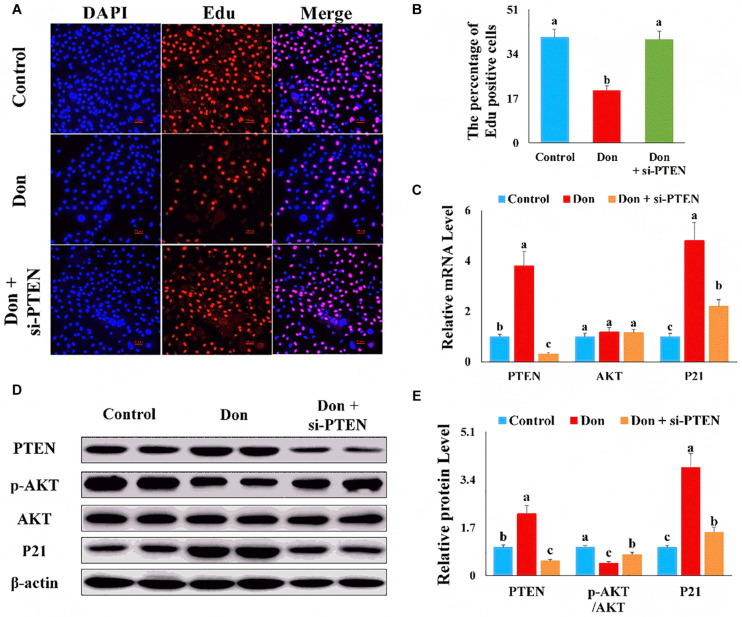
FIGURE 7.
The proliferation inhibition of Don on intestinal epithelial cells relied on PTEN. (A) Representative images of the EdU staining for proliferating intestinal epithelial cells are shown. The cell nucleus was stained with DAPI, blue. Proliferating intestinal epithelial cells were labeled with EdU fluorescent dye (red). (B) The quantitative result of (A). (C) qPCR results indicated that the proliferation inhibition of Don on intestinal epithelial cells relied on PTEN. (D) Western blot results showed the proliferation inhibition of Don on intestinal epithelial cells relied on PTEN. (E) The relative protein levels obtained by WB band gray scanning. The results were presented as mean ± SEM of triplicate independent experiments for each group. Bars with different letters indicate they are significantly different (p < 0.05). In (A), magnification = × 100; the scale bar on the photomicrographs represents 100 μm. Don, IPEC-J2 cells were exposed to 1.6 μg/ml Don for 12 h. Don + si-PTEN, IPEC-J2 cells were transfected with 80 nM si-PTEN mimics for 24 h, then exposed to 1.6 μg/ml Don for 12 h.

