FIGURE 1.

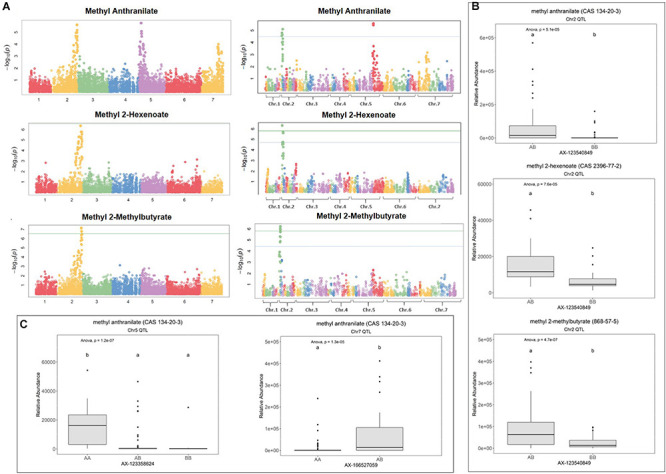
Methyl ester QTL in strawberry fruit. (A) QTL Manhattan plots for methyl anthranilate, methyl 2-hexenoate, and methyl 2-methylbutryrate using the F. vesca physical map (left column) and the FL_08-10 × 12.115-10 genetic map (right column). (B) Effect sizes of a shared methyl ester QTL marker on Chr 2. Lowercase letters indicate statistically significance mean differences at p < 0.05 (ANOVA). (C) Effect sizes for the methyl anthranilate QTL on Chr 5 and the putative Chr 7 QTL.
