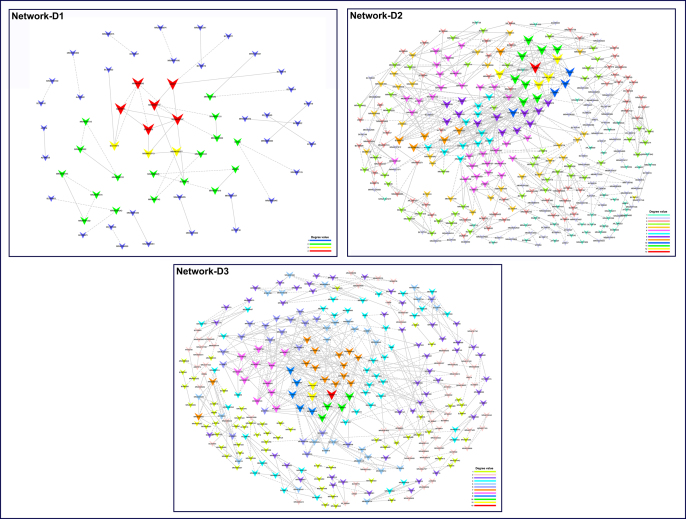
Supplementary Figure S5.
Construction of drug-associated lncRNA-mRNA networks (network-D1, -D2 and -D3). The arrows and circles represent dysregulated lncRNAs and mRNAs, respectively. Different colors and sizes represent the corresponding node degrees. The dashed and solid lines between genes indicate negative and positive correlations, respectively.

