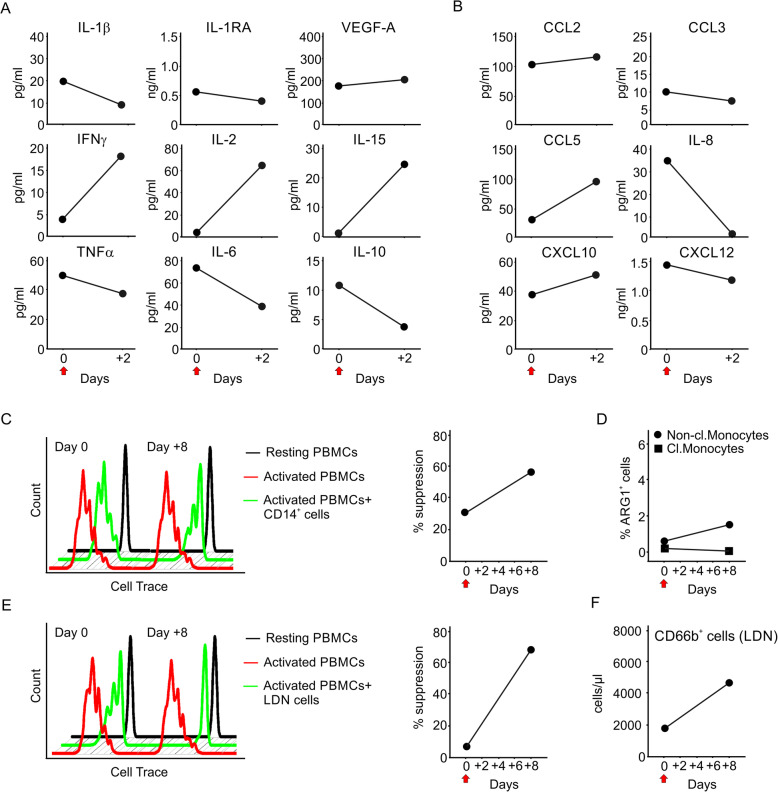
Fig. 3.
Plasma cytokine/chemokine profile, and functional assay. a Plasma levels of cytokines at days 0 and + 2 after MSC infusion. b Plasma levels of chemokines at days 0 and + 2 after MSC infusion. c The immune suppressive ability of monocytes was tested in functional assay on activated T cells and shown as percentage of suppression. d Arginase1+ cells within the monocytes subsets were evaluated by flow cytometry at different time points. e The immune suppressive ability of CD66b+ LDNs was tested in functional assay on activated T cells and shown as percentage of suppression. f LDNs were counted and reported as number of cells/μl. The red arrow indicates the time point in which MSC infusion was performed. For comments, see the text. CCL, C-C motif chemokine ligand; CXCL, C-X-C motif chemokine ligand; Cl., classic; IL, interleukin; IFN, interferon; IL-1RA, interleukin-1 receptor A; LDN, low-density gradient neutrophil; MSC, mesenchymal stromal cell; PBMC, peripheral blood mononuclear cell; TNF, tumor necrosis factor; VEGF, vascular endothelial growth factor

