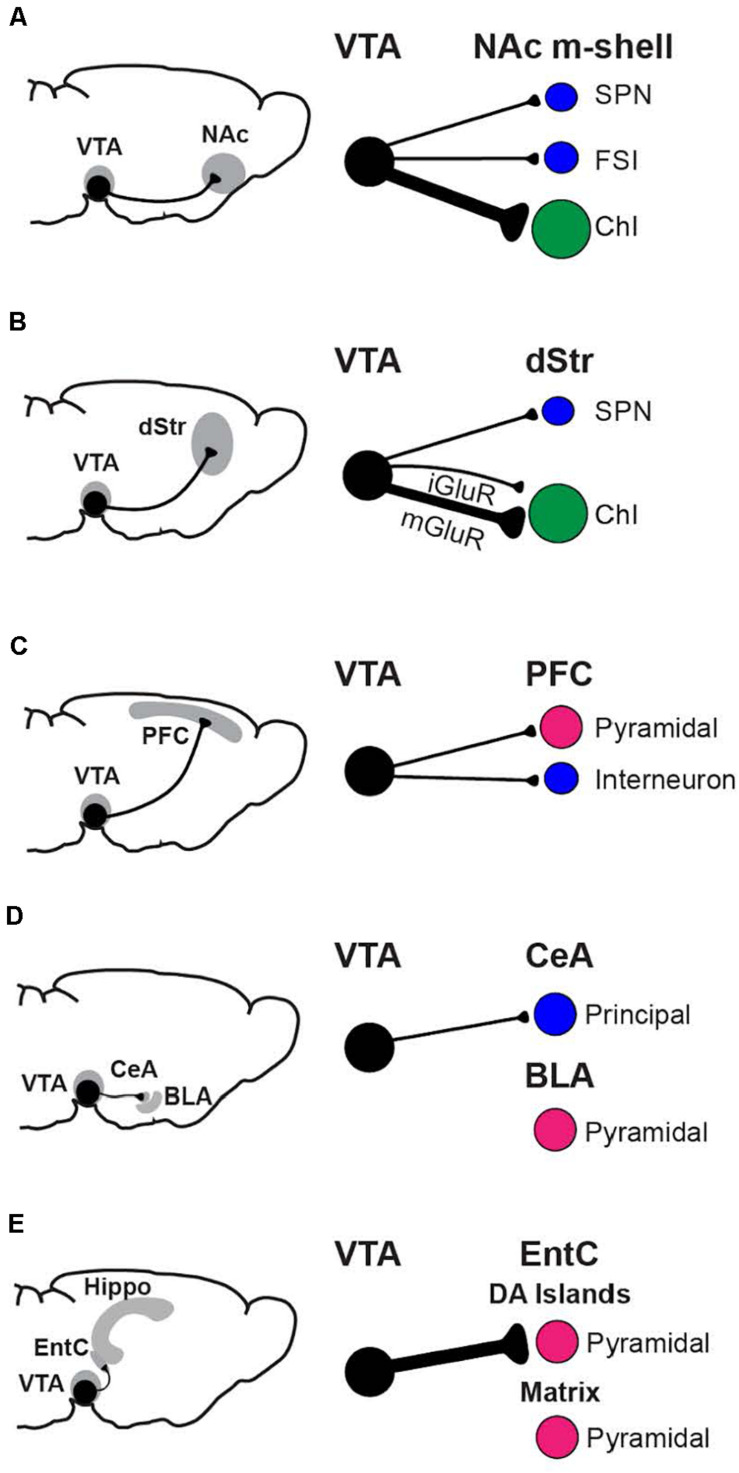
FIGURE 2.
Functional connectome analysis of VTA DA neuron GLU cotransmission. Regions with prominent connections, the NAc m-shell (A), dorsal striatum (B), prefrontal cortex (C), amygdala (D), and hippocampal formation (E) are shown, with the neurons principally targeted by DA-GLU neurons in each region. The strength of connections is indicated by the thickness of the axons (black lines). Postsynaptic neurons are GABAergic (blue), GLUergic (magenta), or cholinergic (green).

