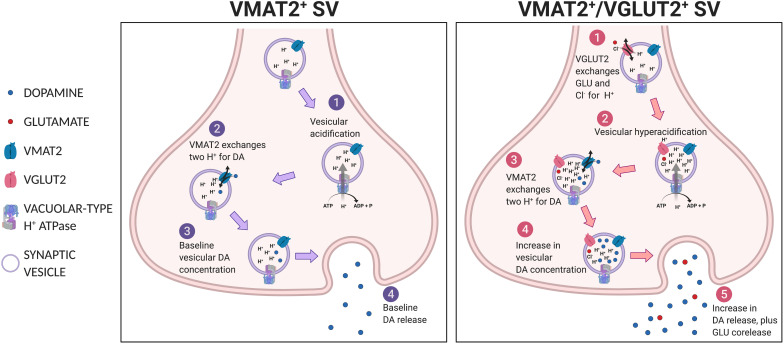
FIGURE 4.
Vesicular synergy. Shown in the left panel, a VMAT2+ SV undergoes (1) vesicular acidification, then (2) VMAT2 exchanges two H+s for DA to achieve (3) baseline vesicular DA concentration and subsequent (4) baseline DA release. Shown in the right panel, a VGLUT2+/VMAT2+ co-expressing SV, (1) VGLUT2 transports GLU and Cl– into SV, which potentiates (2) vacuolar-type H+ATPase to hyperacidify the SV, thus (3) more DA is drawn in via VMAT2 in exchange for protons, resulting in (4) greater intravesicular DA concentration and subsequent release (5).

