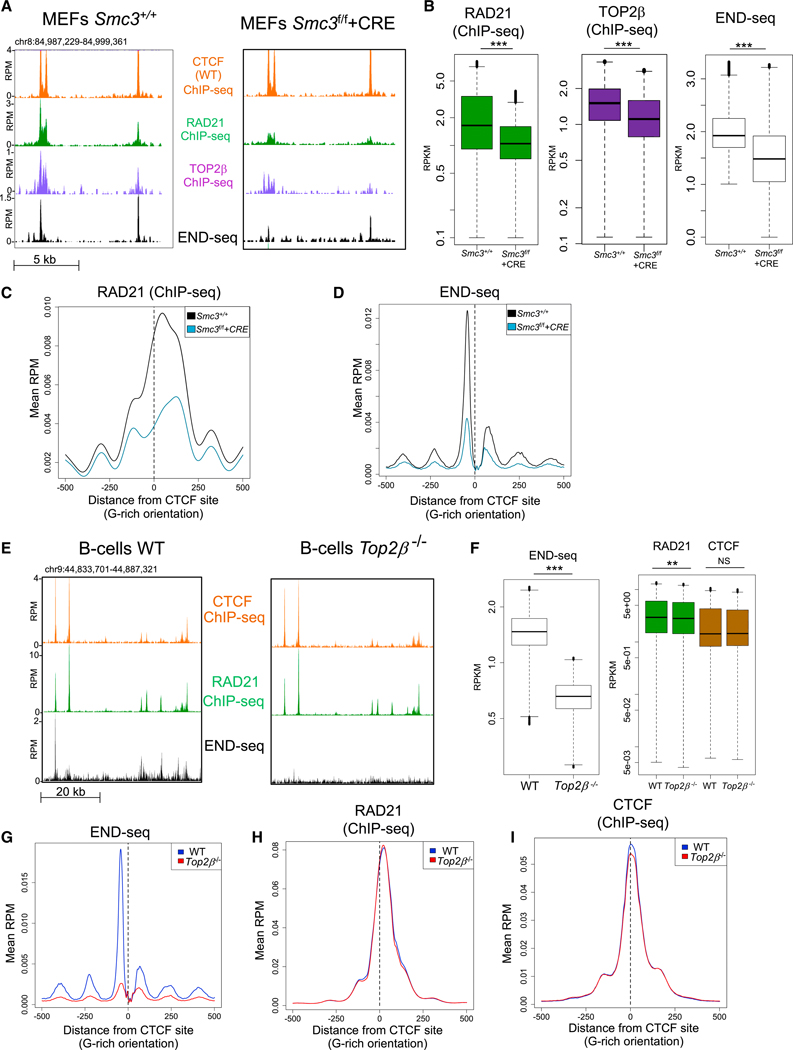
Figure 1. TOP2 Binding and Cleavage Complex (TOP2cc) Formation Is Dependent on Cohesin.
(A) Representative genomic profiles (top to bottom): CTCF, RAD21, TOP2B ChlP-seq, and END-seq. Both CTCF ChlP-seq tracks correspond to Smc3+/+ MEFs. RAD21, TOP2B, and END-seq profiles correspond to Smc3+/+ MEFs (left), and Smc3f/f MEFs in which SMC3 was depleted by CRE-mediated recombination (Smc3f/f +CRE; right). END-seq was performed after 30 min of ETO treatment.
(B) Quantification of the levels of RAD21 and TOP2B binding without ETO, and END-seq upon ETO in Smc3+/+ and Smc3f/f +CRE MEFs. Peaks sets were derived from END-seq signals in Smc3+/+ data. ***p < 1e–20; t test.
(C) Aggregate plot of RAD21 binding in Smc3+/+ (black line) and Smc3f/f +CRE (blue line) MEFs at the double CTCF/RAD21-bound sites ± 500 bp from the CTCF motif (dashed line).
(D) Aggregate plot of END-seq signal upon ETO in Smc3+/+ (black line) and Smc3f/f +CRE (blue line) MEFs at CTCF/RAD21-bound sites ± 500 bp from the CTCF motif (dashed line).
(E) Representative genomic profiles (top to bottom): ChlP-seq for CTCF, ChlP-seq for RAD21, and END-seq in WT (left) and in Top2β−/− (right) B cells. ChlP-seq was performed without ETO treatment.
(F) Left: quantification of the END-seq signal at END-seq peaks in WT and in Top2β−/− B cells. Right: quantification CTCF and RAD21 binding at END-seq peaks in WT and in Top2β−/− B cells. **p < 1e–8; ***p < 1e–30; NS: p > 0.4, t test.
(G-l) Aggregate plots of END-seq signal upon ETO treatment (G), RAD21 binding (H), and CTCF binding (l), in WT (blue line) and Top2β−/− (black line) B cells at CTCF/RAD21-bound sites ± 500 bp from the CTCF motif (dashed line).

