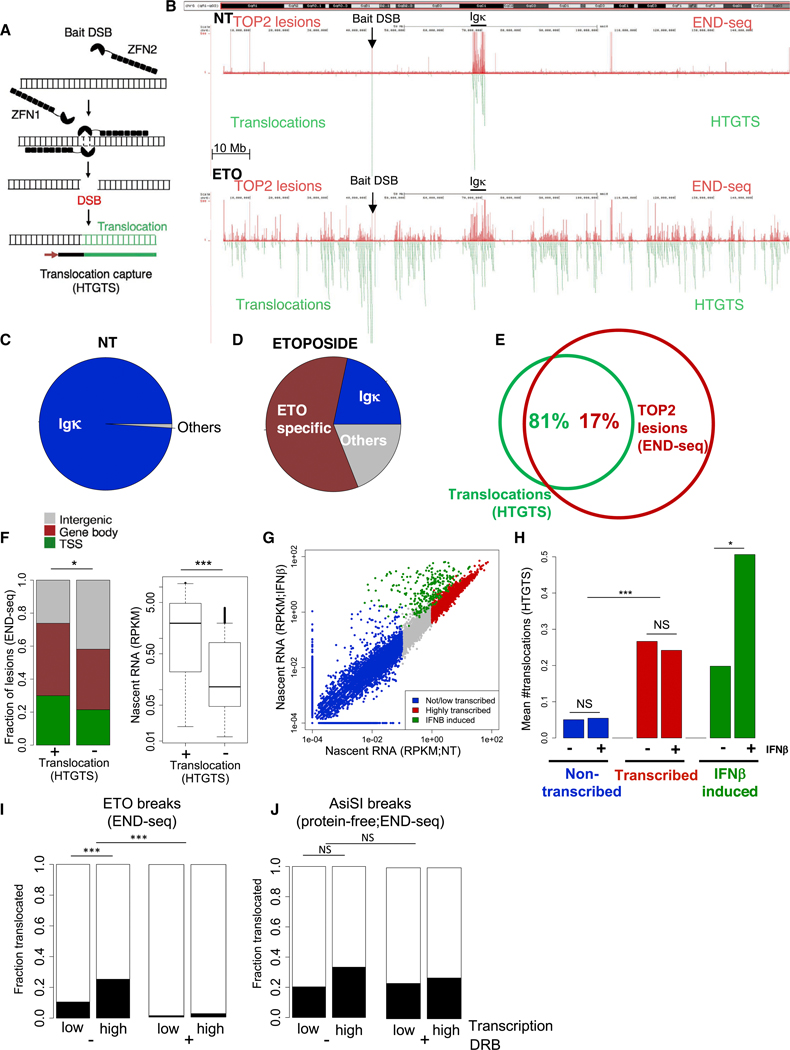
Figure 2. Transcription Promotes Chromosomal Translocations of TOP2cc Sites.
(A) Schematic representation of translocation sequencing by HTGTS. lnduction of a ZFN “bait” break is shown to be translocated to (“prey”) sequences (green). HTGTS uses a primer labeled with biotin to extend from one junction of the bait break to copy the translocation as described (Frock et al., 2015).
(B) Representative genomic profile of chromosome 6 comparing TOP2 lesions, detected by END-seq signal (top, red), and translocations (bottom, green), detected by HTGTS, in pre-B cells not treated (NT, upper) and treated with ETO for 2.5 h (lower). HTGTS was performed 12 h after ETO washout, while END-seq was performed immediately after ETO. Bait DSB position and Igκ locus are indicated. 9 million reads were sequenced for each HTGTS sample.
(C) Pie chart representation of translocations in cis to the bait (chr6) in absence of ETO treatment (NT).
(D) Pie chart representation of translocations in cis to the bait (chr6) upon ETO treatment.
(E) Venn diagram showing the overlap between translocations in cis to the bait (chr6) (green) and TOP2 lesions detected by END-seq upon ETO treatment (chr6) (red). *p < 1e−10, hypergeometric test.
(F) Comparison of the genomic location (left) and nascent RNA levels (right) of TOP2 lesions in chromosome 6 between the lesions that overlap with translocations and those that do not. *p < 1e–4, fisher-test. ***p < 1e–20, t test.
(G) Dotplot comparing of gene transcription levels between NT and lFNβ treatment. Colors represent level of transcription and dependency of lFNβ. *p < 0.01;***p < 1e–35; Wilcoxon test.
(H) Barplot comparing the mean number of translocations detected in the presence or absence of lNFβ in genes that are non-transcribed, transcribed, and lNFβ induced. 6 million reads were sequenced for each sample.
(I) Left: comparison of that fraction of TOP2 lesions that translocate in sites that exhibit low transcription (RPKM < 0.1) versus highly transcribed (RPKM > 1) sites. Right: same comparison upon transcription inhibition with DRB. 6 million reads were sequenced for each sample.
(J) Left: comparison of the fraction of AsiSl-induced protein-free DSBs that translocate to sites that exhibit low transcription (RPKM < 0.1) versus high transcription (RPKM > 1). Right: same comparison upon transcription inhibition with DRB. ***p < 1e–10; NS:p > 0.08. Transcription determined by nascent RNA prior to DRB treatment. 6 million reads were sequenced for each HTGTS sample.

