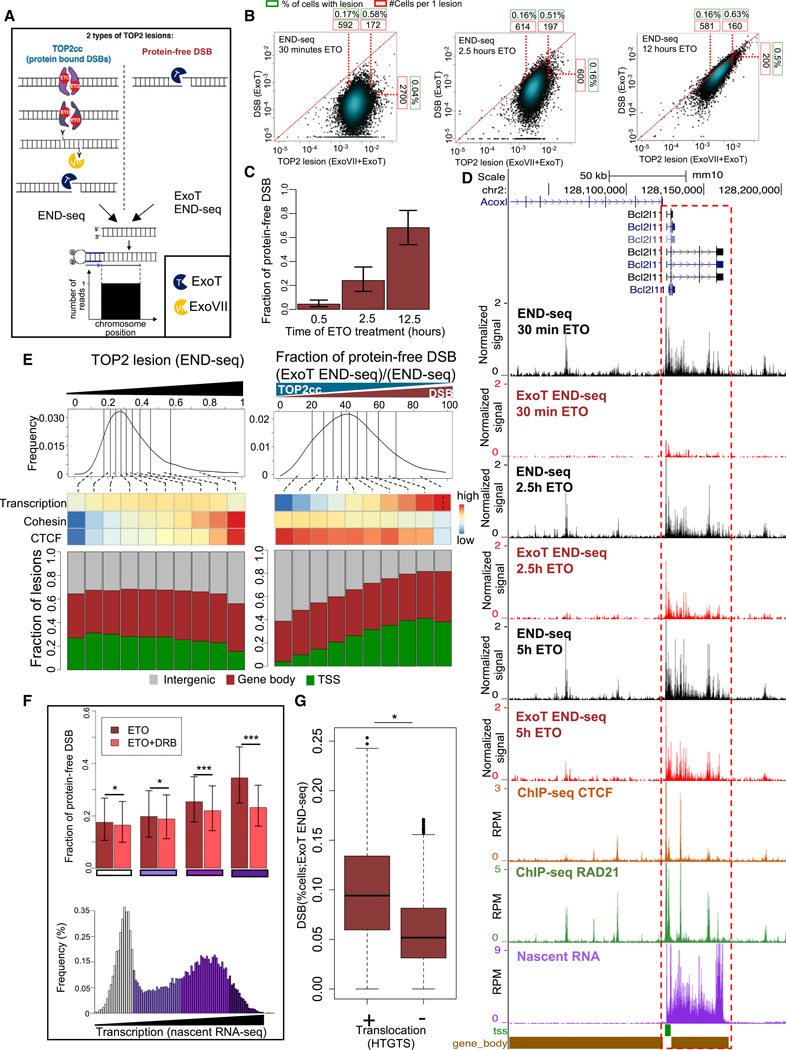
Figure 3. Genome-wide Quantification of the Processing of TOP2cc to Protein-free DSBs Reveals the Facilitating Role of Transcription.
(A) Schematic representation of the different species of TOP2 lesions (left from top to bottom: intact TOP2cc, partially degraded TOP2, and completely degraded TOP2; right: protein-free DSB) and their detection by END-seq. “END-seq” utilizes ExoT+ExoVll for detection of total TOP2 lesions, whereas “ExoT END-seq” utilizes ExoT alone for detection of protein-free DSBs.
(B) Scatterplots that show the levels of END-seq signal obtained by utilizing ExoT+ExoVll (xaxis) or ExoT alone (y axis), representing total TOP2 lesion levels and the protein-free DSB fraction, respectively, for each TOP2cc site, after (left to right) 30 min, 2.5 h, and 12.5 h of ETO treatment. Number of cells per single lesion (red boxes) and % cells per lesion (green boxes) are represented for the 10th and 90th percentile of TOP2 lesions and the 90th percentile of DSBs.
(C) The ratio of protein-free DSB to total TOP2 lesions (i.e., “Fraction of protein-free DSB”) for the three time-points of ETO treatment illustrated in (B). Error bars represent the distribution of this fraction over different break sites.
(D) Representative genomic profile ofTOP2 lesions (detected by END-seq using ExoVll+ExoT) and DSBs (detected by END-seq using ExoT alone) after 30 min, 2.5 h, and 5 h ETO; binding ofCTCF, cohesin (RAD21) (detected by ChlP-seq), and nascent RNA-seq in the absence of ETO. Gene body (brown bars) and TSSs (green bars) are indicated. Values in DSB panels are normalized by the corresponding spike-in (see STAR Methods).
(E) Top: TOP2 lesions were divided into deciles with respect to their level ofTOP2 trapping (left), measured at 30 min post ETO treatment, or processing levels (right) (histogram; top row), measured at 2.5 h post ETO treatment. Middle: the average levels of(top to bottom) transcription, cohesin (RAD21), and CTCF binding were plotted as a heatmap for each decile. Correlation with TOP2 trapping: ρ = 0.98, 1, and 0 for CTCF, cohesin and transcription respectively. Correlation with TOP2 processing: ρ = −0.91, −0.98, and 0.51, for CTCF, cohesin, and transcription respectively. Spearman Correlation Coefficient between deciles. Bottom: The distribution of genomic localization (TSSs, gene body, and intergenic) is shown for each decile.
(F) Bottom: histogram of transcription levels. Colors represent the different quartiles, from low and non-transcribed (white) to highly transcribed (dark purple).Top: the average fraction of protein-free DSB was measured for each quartile presented in the histogram below, with or without treatment with transcription inhibitor DRB (red and salmon, respectively). Error bars represent the distribution of this fraction in each quartile over different break sites. *p < 1e–4;***p < 1e–20, t test.
(G) Boxplots show the distribution of DSB levels in translocated and non-translocated TOP2 lesions (represented as % cells). ***p < 1e–74; t test.

