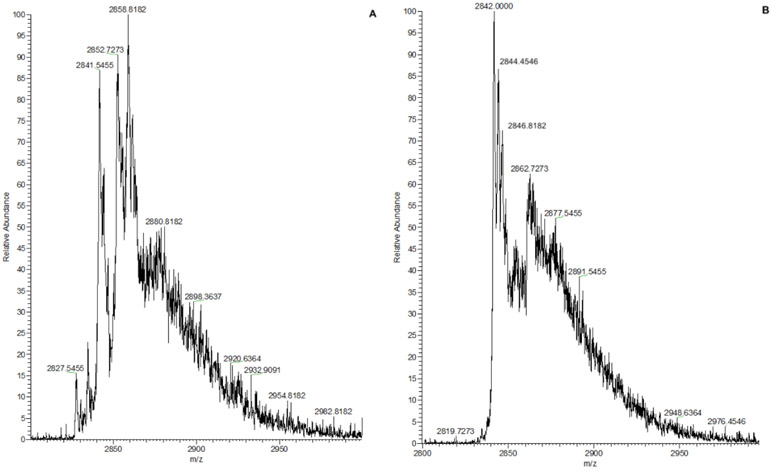
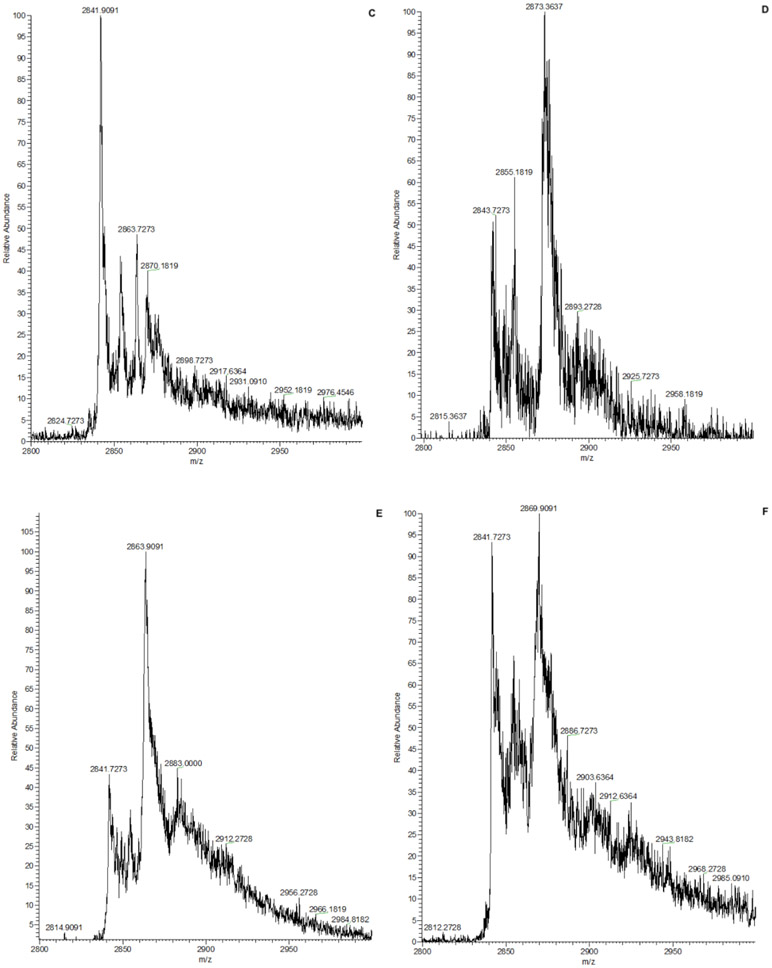
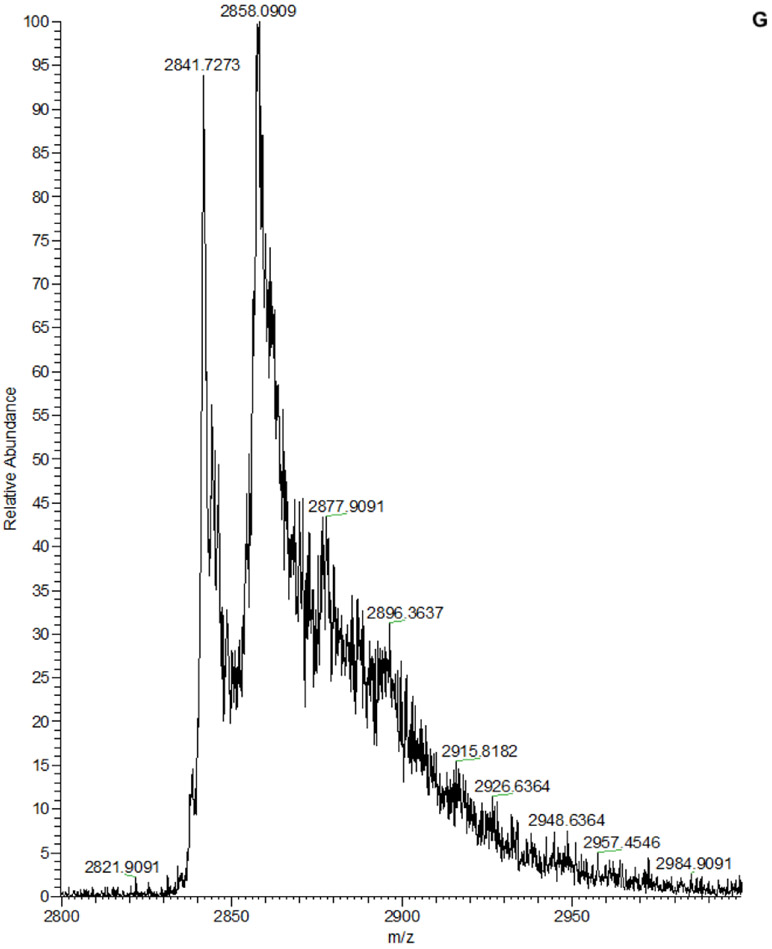
Figure 3: The native MS spectra for IMP-1 bound with inhibitors under positive observation mode from 2800 m/z to 3000 m/z.
The buffer was 100 mM ammonium acetate, pH 7.5. (A) 10 μM IMP-1 with 5 equivalents of DPA. (B) 10 μM IMP-1 with 5 equivalents of 1T5PA. (C) 10 μM IMP-1 with 5 equivalents of 3AP-DPA. (D) 10 μM IMP-1 with 5 equivalents of ANT431. (E) 10 μM IMP-1 with 5 equivalents of captopril. (F) 10 μM IMP-1 with 5 equivalents of thiorphan. (G) 10 μM IMP-1 with 5 equivalents of tiopronin.


