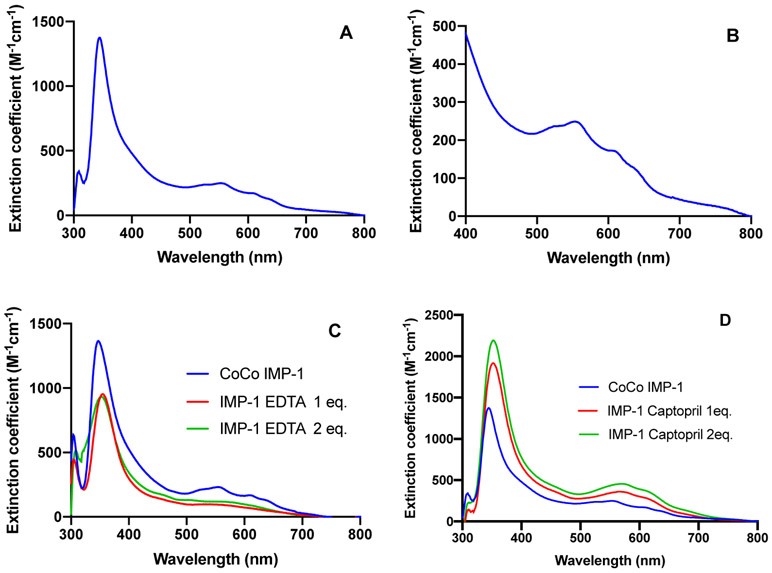
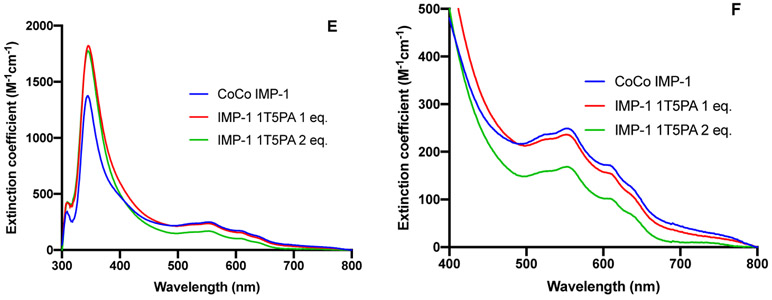
Figure 4: The UV-VIS spectra for CoCo-IMP-1 and CoCo-IMP-1 with EDTA, captopril, and 1T5PA.
The concentration of IMP-1 used in this experiment is 300 μM. (A) The UV-VIS spectrum CoCo-IMP-1. (B) Enlarged view of the spectrum from 400 nm to 800 nm for CoCo-IMP-1. (C) The UV-VIS spectrum after addition of 1 (red) and 2 (green) equivalents of EDTA. (D) The UV-VIS spectrum after addition of 1 (red) and 2 (green) equivalents of Captopril. (E) The UV-VIS spectrum after addition of 1 (red) and 2 (green) equivalents of 1T5PA. (F) The enlarged view of the spectrum from wavelength 400 nm to 800 nm after addition 1 (red) and 2 (green) equivalents of 1T5PA.


