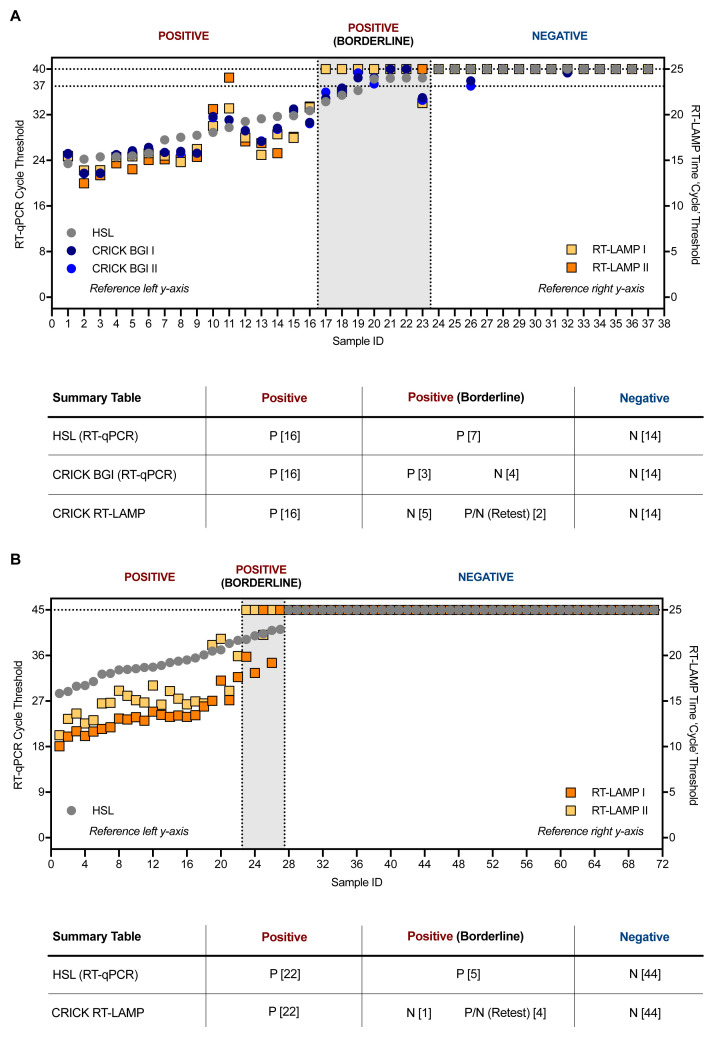
Figure 5. Clinical validation of SARS-CoV-2 RT-LAMP.
( A) 37 patient samples were processed in parallel by HSL and the CCC pipeline and interrogated by HSL’s RT-qPCR (N gene) and the CCC’s BGI RT-qPCR (ORF1a) in duplicate. RNA left from the CCC pipeline was assessed in two separate experiments by N gene RT-LAMP. The graph indicates Ct values for HSL and CCC RT-qPCR runs by left y-axis and ‘Ct’ time thresholds for RT-LAMP via the right y-axis. Data are normalised by assay run/cycles determined by the two methods for comparative purposes. The clinical call from the reference laboratory is depicted above the summary table provided below. Positives (P) with low Ct values were reliably detected by RT-LAMP, whilst ‘borderline positive’ (samples with Ct values near the limit of detection of each RT-qPCR assay) were inconsistently detected, displaying no visible amplification at times – negative (N). ( B) 71 VTM samples from HSL were RNA-extracted through the CCC pipeline and interrogated by HSL RT-qPCR (45 cycles), or by two independent N gene RT-LAMP experiments (25 minutes). ( A–B) RT-LAMP assays were performed with 3 µL of sample RNA.

