FIGURE 4.

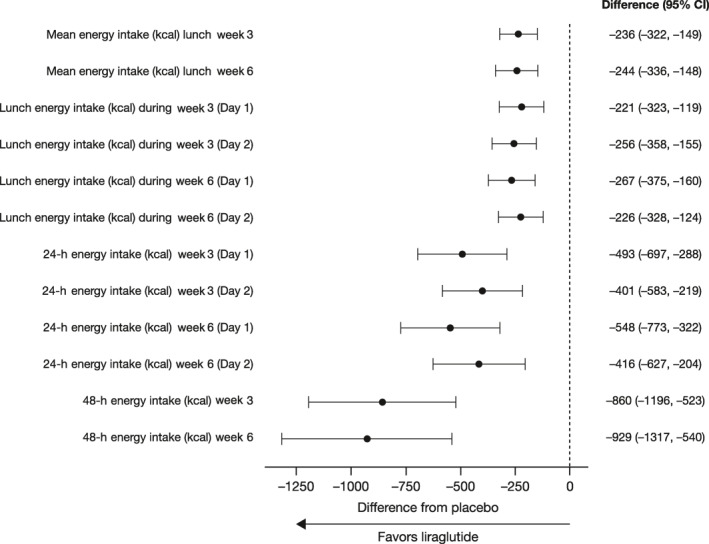
A forest plot of the placebo‐adjusted least squares mean change from baseline at weeks 3 and 6 for EI outcomes. CI, confidence interval; EI, energy intake.

A forest plot of the placebo‐adjusted least squares mean change from baseline at weeks 3 and 6 for EI outcomes. CI, confidence interval; EI, energy intake.