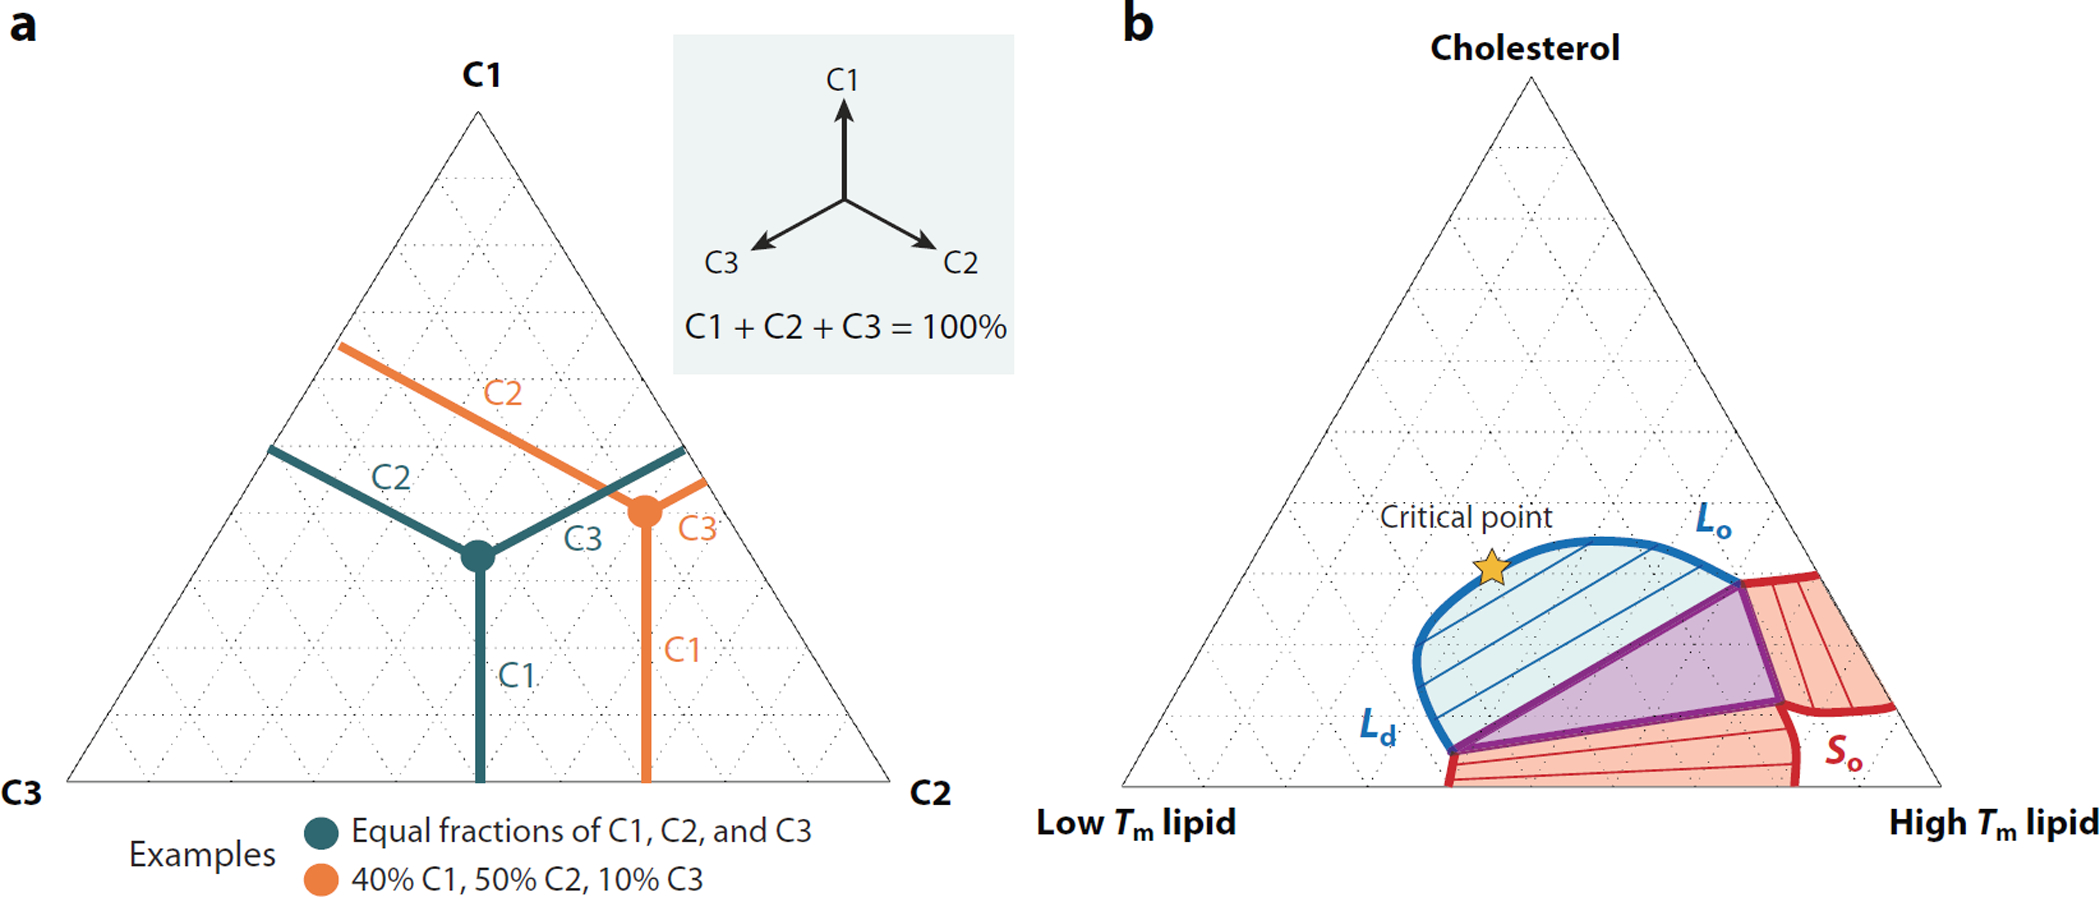
Figure 1.

Phase diagram of lipid mixtures. (a) Phase diagrams of three component mixtures (C1, C2, and C3) are conventionally drawn on an equilateral triangle. The three vertices are pure mixtures of each lipid component, points along the edges are binary mixtures, and points within the triangle contain all three components. Compositions can be read by measuring the perpendicular distance to each edge and adding the resulting percentages, which always sum to 100%. Two examples are shown. (b) A qualitative phase diagram for ternary lipid mixtures of high melting temperature (Tm) lipids, low Tm lipids, and cholesterol. Thick red lines indicate the boundaries of liquid–solid (So) coexistence, and the thick blue line represents the boundary of liquid-liquid coexistence of the liquid-disordered (Ld) and liquid-ordered (Lo) phases. Points along this boundary also indicate the composition of coexisting phases, and the specific compositions in coexistence are indicated by blue and red shaded areas within binary coexistence regions. The purple triangle represents compositions that exhibit all three phases in coexistence. The compositions of the three phases are indicated by the three vertices of the triangle. The Ld–Lo coexistence region terminates at a miscibility critical point along the high cholesterol edge that is indicated by an orange star.
