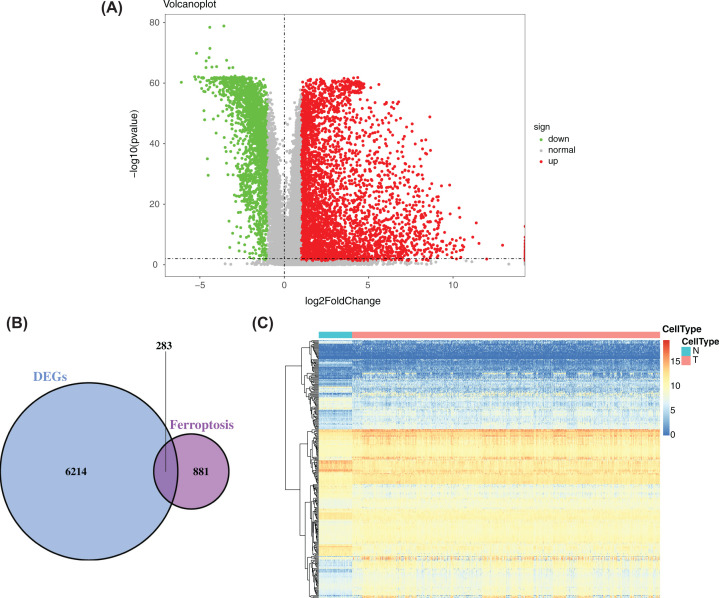
Figure 2. Identification of ferroptosis-related DEGs.
(A) Volcano plot of DEGs between cancer tissue and paracancerous tissue in NSCLC patients in the training set. Red represents up-regulation, blue represents down-regulation, and yellow represents intermediate transition. (B) Venn diagram of the intersections of DEGs and ferroptosis-related genes. (C) Expression distribution of 283 DEGs obtained in the training set.

