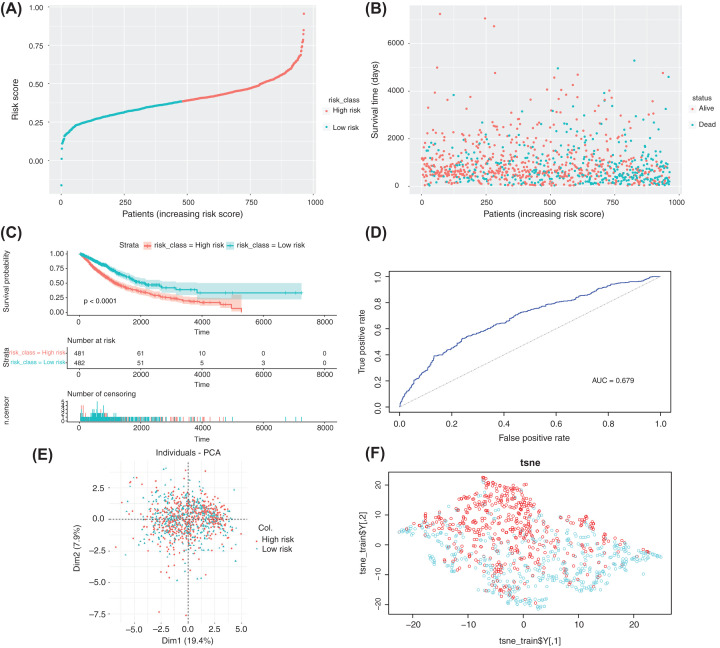
Figure 5. Construction of a risk-prediction model of the training set and analyses of model performance.
(A and B) Risk chart of the training set. Distributions of risk scores and survival times of samples from the TCGA database. (C) A KM curve was used to analyze differences in survival time between high-risk and low-risk groups, which were divided according to the risk model constructed by the training set, P<0.0001. (D–F) ROC curves, PCA, and t-SNE visualization demonstrating the performance of the risk model constructed using the training set.

