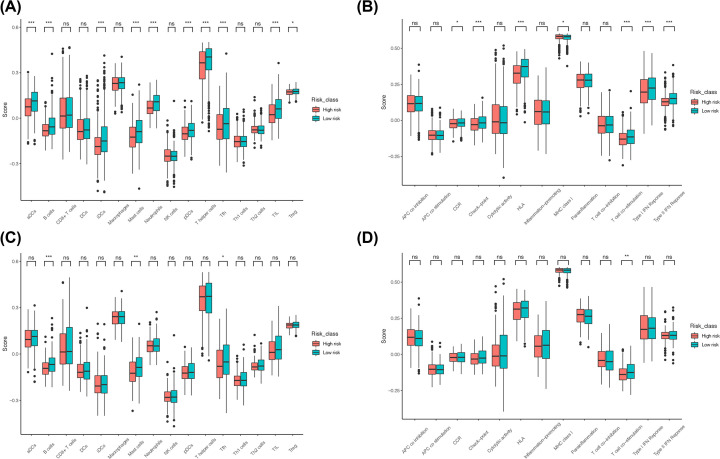
Figure 9. Analysis of ferroptosis-related genes associated with immune-related functions in high-risk and low-risk groups.
(A and B) Analysis of differences in immune cells and immune-related pathways between the high-risk and low-risk groups in the training set. (C and D) Analysis of differences in immune cells and immune-related pathways between the high-risk and low-risk groups in the validation set.

