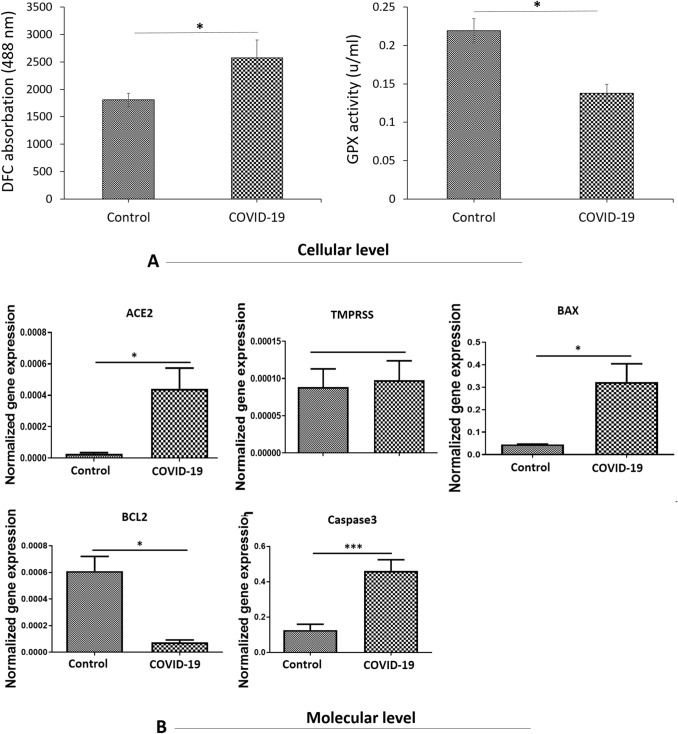
Fig. 7.
A ROS production and level of GSH in testis tissue. Mean ± SD of the ROS production and GPX activity level in the study groups; (*P < 0.05). B Real-time-PCR analyses. mRNA expression levels of (ACE2, TMPRSS2, BAX, BCL2 and Caspase3) in the testis tissue. Mean ± SD of the genes expression in the different groups (*P < 0.05 and ***P < 0.001). PCR, polymerase chain reaction

