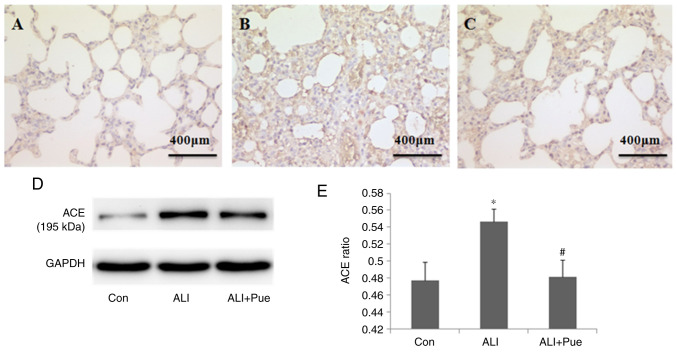
Figure 4.
Effect of puerarin on ACE expression. (A) Representative images from immunohistochemical analysis of ACE expression in lung tissue sections from rats of the Con group, (B) ALI and (C) ALI + Pue groups. (D) Representative images from western blot analysis for ACE protein expression levels in the lungs. (E) Quantification of ACE protein expression levels relative to GAPDH. Data are presented as the mean ± the standard error of the mean from three independent experiments (n=10 per group). *P<0.05 vs. Con group; #P<0.05 vs. ALI group. ACE, angiotensin-converting enzyme; Con, normal control group; ALI, smoke inhalation group; ALI + Pue, puerarin treatment plus smoke inhalation group.

