
Fig. 3. Increased pSTAT3 enrichment at target genes in the hippocampus of ethanol withdrawn rats after chronic exposure.
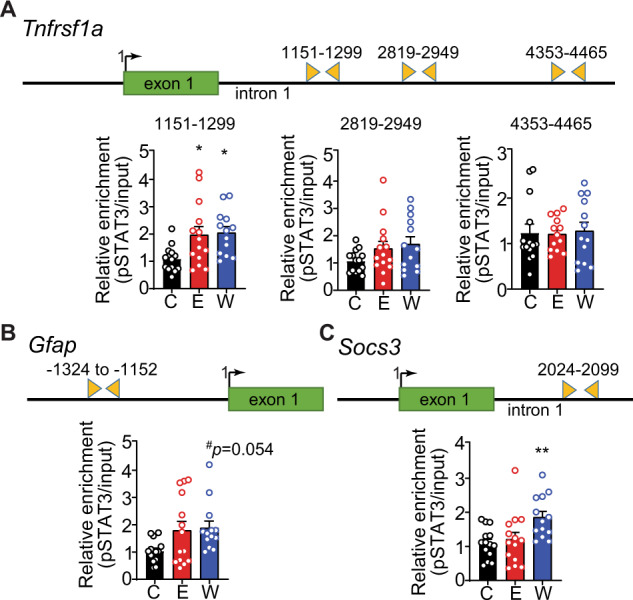
Rats were fed control liquid diet (C, n = 13), ethanol liquid diet (E, n = 14), or ethanol liquid diet (n = 13) followed by 24 h of withdrawal from ethanol diet (W). The dorsal hippocampus was dissected and chromatin immunoprecipitation (ChIP) was performed using an antibody to phosphorylated STAT3 (pSTAT3), followed by qPCR with primers surrounding predicted STAT3 binding sites. Shown above each graph is a schematic of each gene with primer locations indicated by triangles. A Bar diagram shows relative pSTAT3 enrichment in the first intron of Tnfrsf1a between 1151 and 1299 bp downstream of the transcription start site but not at sites further downstream (2819–2949 and 4353–4465). Bar diagrams show relative pSTAT3 enrichment at the B Gfap promoter and C first intron of Socs3. Data are presented as the mean ± SEM. *p < 0.05 and **p < 0.01 compared with control by Tukey’s test after one-way ANOVA.