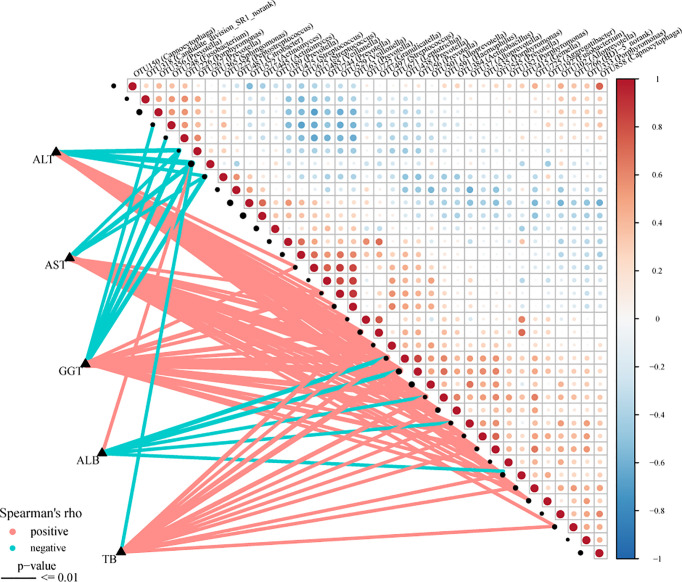
Figure 8.
Associations between oral microbiomes and clinical indices of AIH. Distance correlation plots of the relative abundance of 37 OTUand clinical indices, including ALB, GGT, TB, ALT and AST. Positive values (red) indicate positive correlations, and negative values (blue) indicate inverse correlations. The full lines present “P-value ≤ 0.01”. The sign of the correlation was determined using Spearman’s method. Spearman’s method was used to determine the sign of the correlation. AIH, autoimmune hepatitis; ALB, albumin; TB, total bilirubin; GGT, gamma-glutamyltransferase; ALT, alanine aminotransferase; AST, aspartate aminotransferase; AIH, autoimmune hepatitis.

