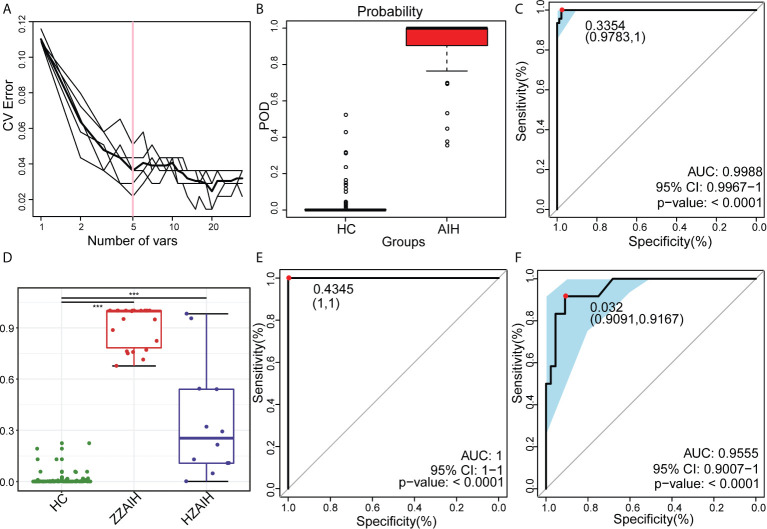
Figure 9.
Oral microbiome as non-invasive diagnostic model for AIH. (A) As shown in the cross-validation error curve, we used the random forest models to identify five OTUs as the optimal biomarkers. (B) The POD value was significantly increased in AIH versus HCs. (C) The POD index achieved an AUC value of 99.88% with a 95% CI of 99.67% to 100% between AIH patients and HCs in the discovery phase. (D) The POD value of the ZZ-AIH group from Zhengzhou (n=46) and the HZ-AIH group from Hangzhou (n=12) were significantly higher than the POD value of the HCs group (n=44) (P<0.001). (E) The POD index achieved an AUC value of 100% between AIH and HCs in the validation phase. (F) Twelve AIH patients from Hangzhou were cross-regionally validated with 44 healthy controls. The AUC value reached 95.55%, and its 95% CI was 90.07%-100% (p<0.0001). OTUs, operational taxonomic units; POD, probability of disease; CV error, cross-validation error; AUC, area under the curve; AIH, autoimmune hepatitis; HCs, healthy controls.

