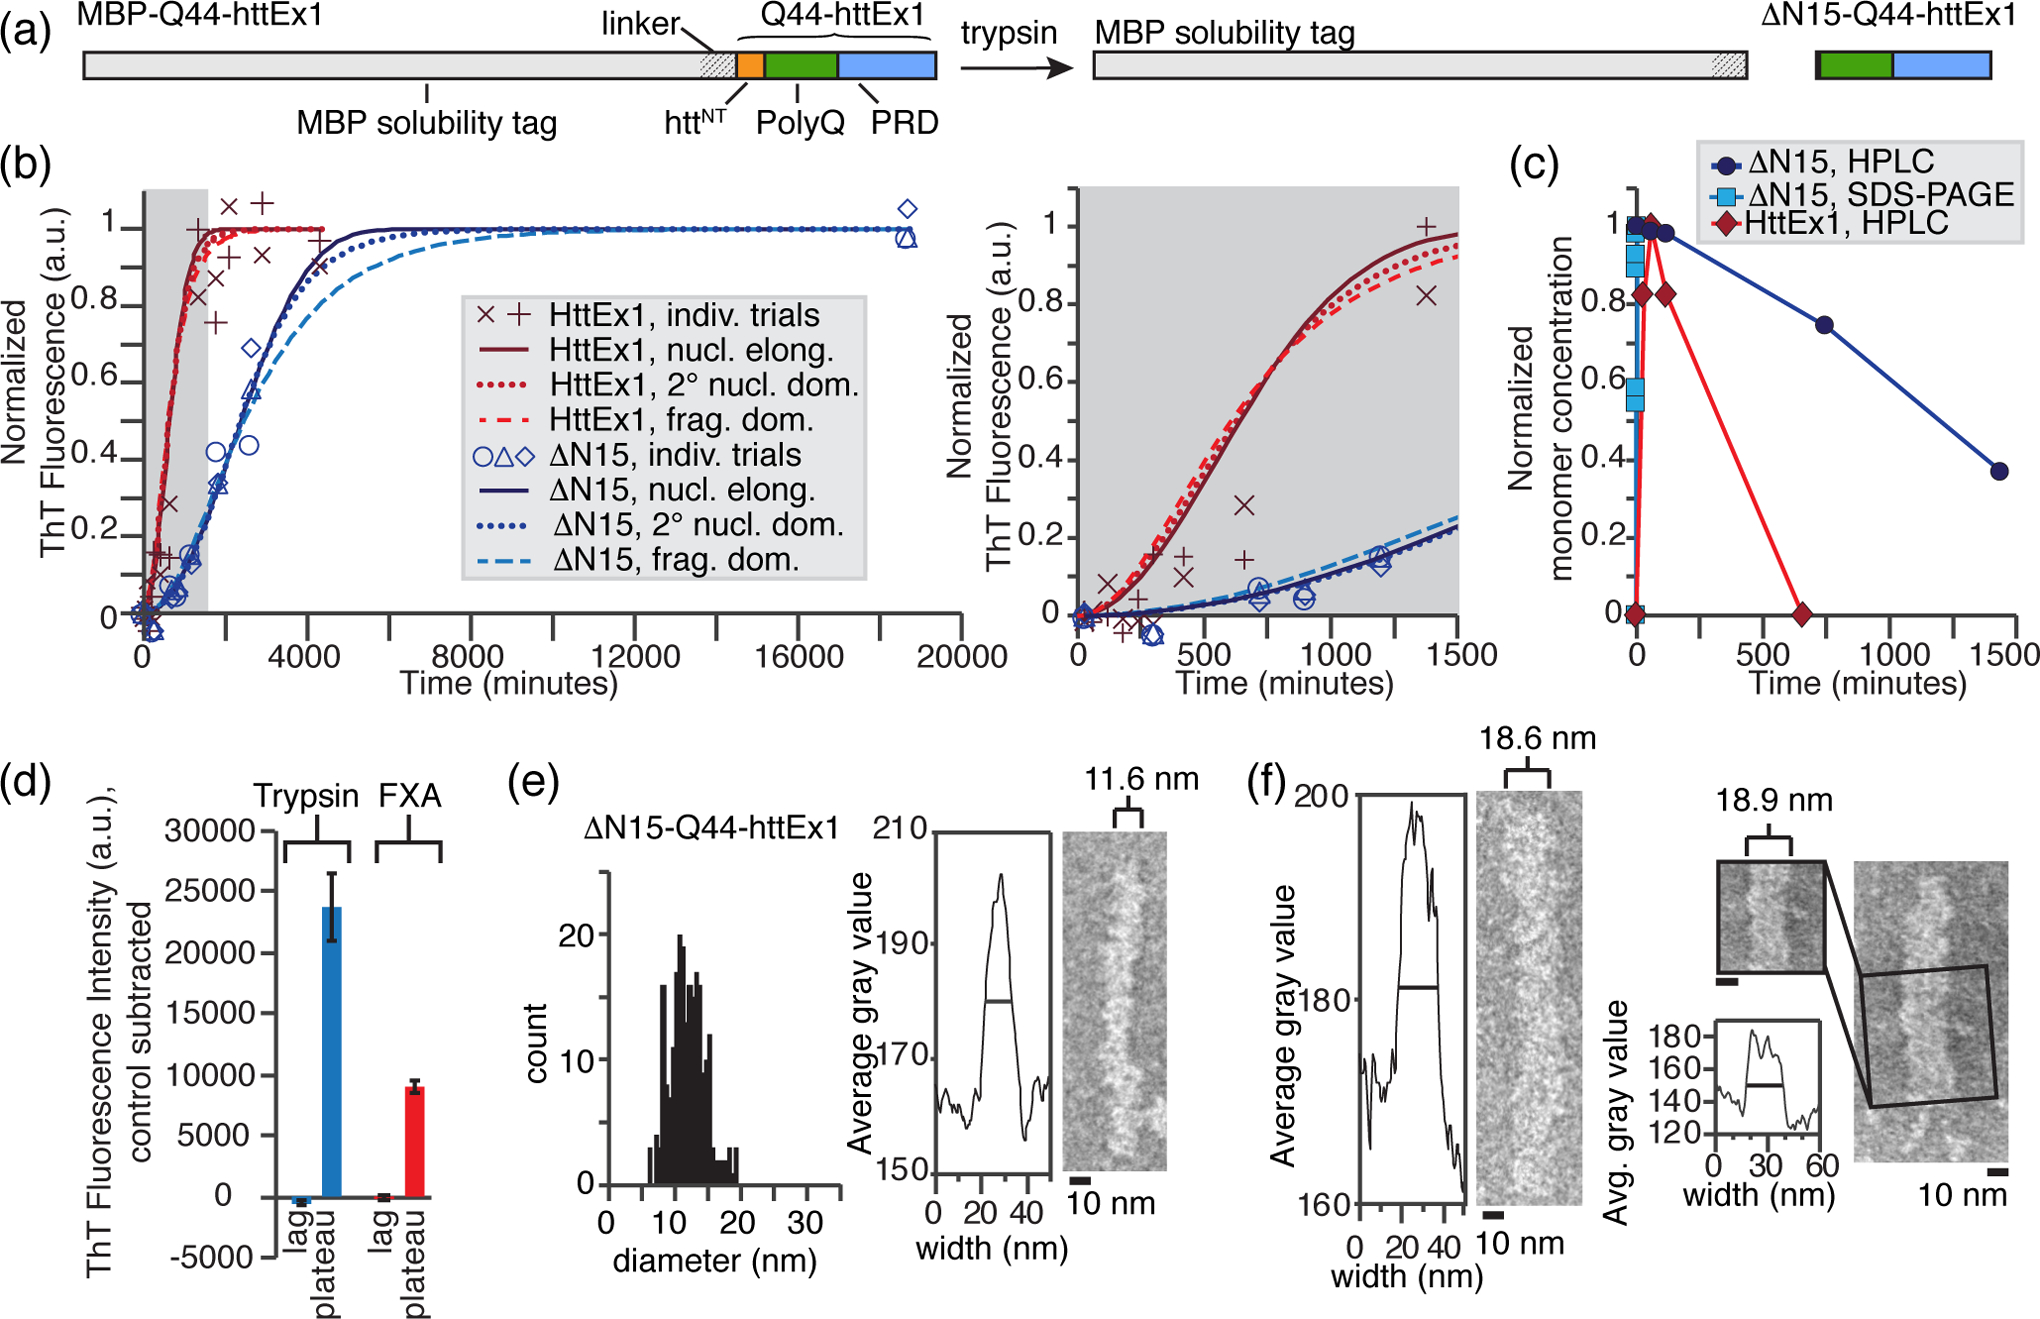
Fig. 4. Morphology of ΔN15-Q44-HttEx1 fibrils that lack most of httNT.

(a) Schematic diagram of the employed cleavage reaction, in which trypsin cleavage liberates ΔN15-Q44-HttEx1 after a rapid multistep cleavage process [Fig. S6]. (b) The formation of Q44-HttEx1 (red) and ΔN15-Q44-HttEx1 (blue) amyloid fibrils over time tracked by ThT fluorescence, normalized to the maximum fluorescence of the predicted curves (nucleated elongation) for each. Data is fit to nucleated elongation (solid), secondary nucleation dominated (dotted), and fragmentation dominated (dashed) aggregation kinetics models using AmyloFit [60]. Right: magnified inset of the lag phase. (c) Normalized Q44-HttEx1 (red) and ΔN15-Q44-HttEx1 (blue) monomer concentrations over time following cleavage by FXa and trypsin, respectively, measured by SDS-PAGE and HPLC [36]. The HPLC assays were performed in parallel to the ThT fluorescence assays. (d) Average ThT fluorescence in the lag and plateau phase for Q44-HttEx1 (red) and ΔN15-Q44-HttEx1 (blue). The average fluorescence of a control sample containing MBP-Q44-HttEx1 only was subtracted for each. The lag phase was measured at 50 and 60 minutes for ΔN15-Q44-HttEx1 (n = 3) and Q44-HttEx1 (n = 2), respectively. The plateau phase was measured at 4 and 3 days for ΔN15-Q44-HttEx1 (n = 3) and Q44-HttEx1 (n = 2) respectively. (e) Distribution of widths measured for ΔN15-Q44-HttEx1 fibrils, outfitted with uniform 13C,15N labels for ssNMR. The average width is between 11–12 nm (right), however a wide distribution of widths was observed (left). (f) Wide ΔN15-Q44-HttEx1 fibrils (~ 18 – 19 nm). Right: evidence of striations consistent with a supramolecular multifilament structure.
