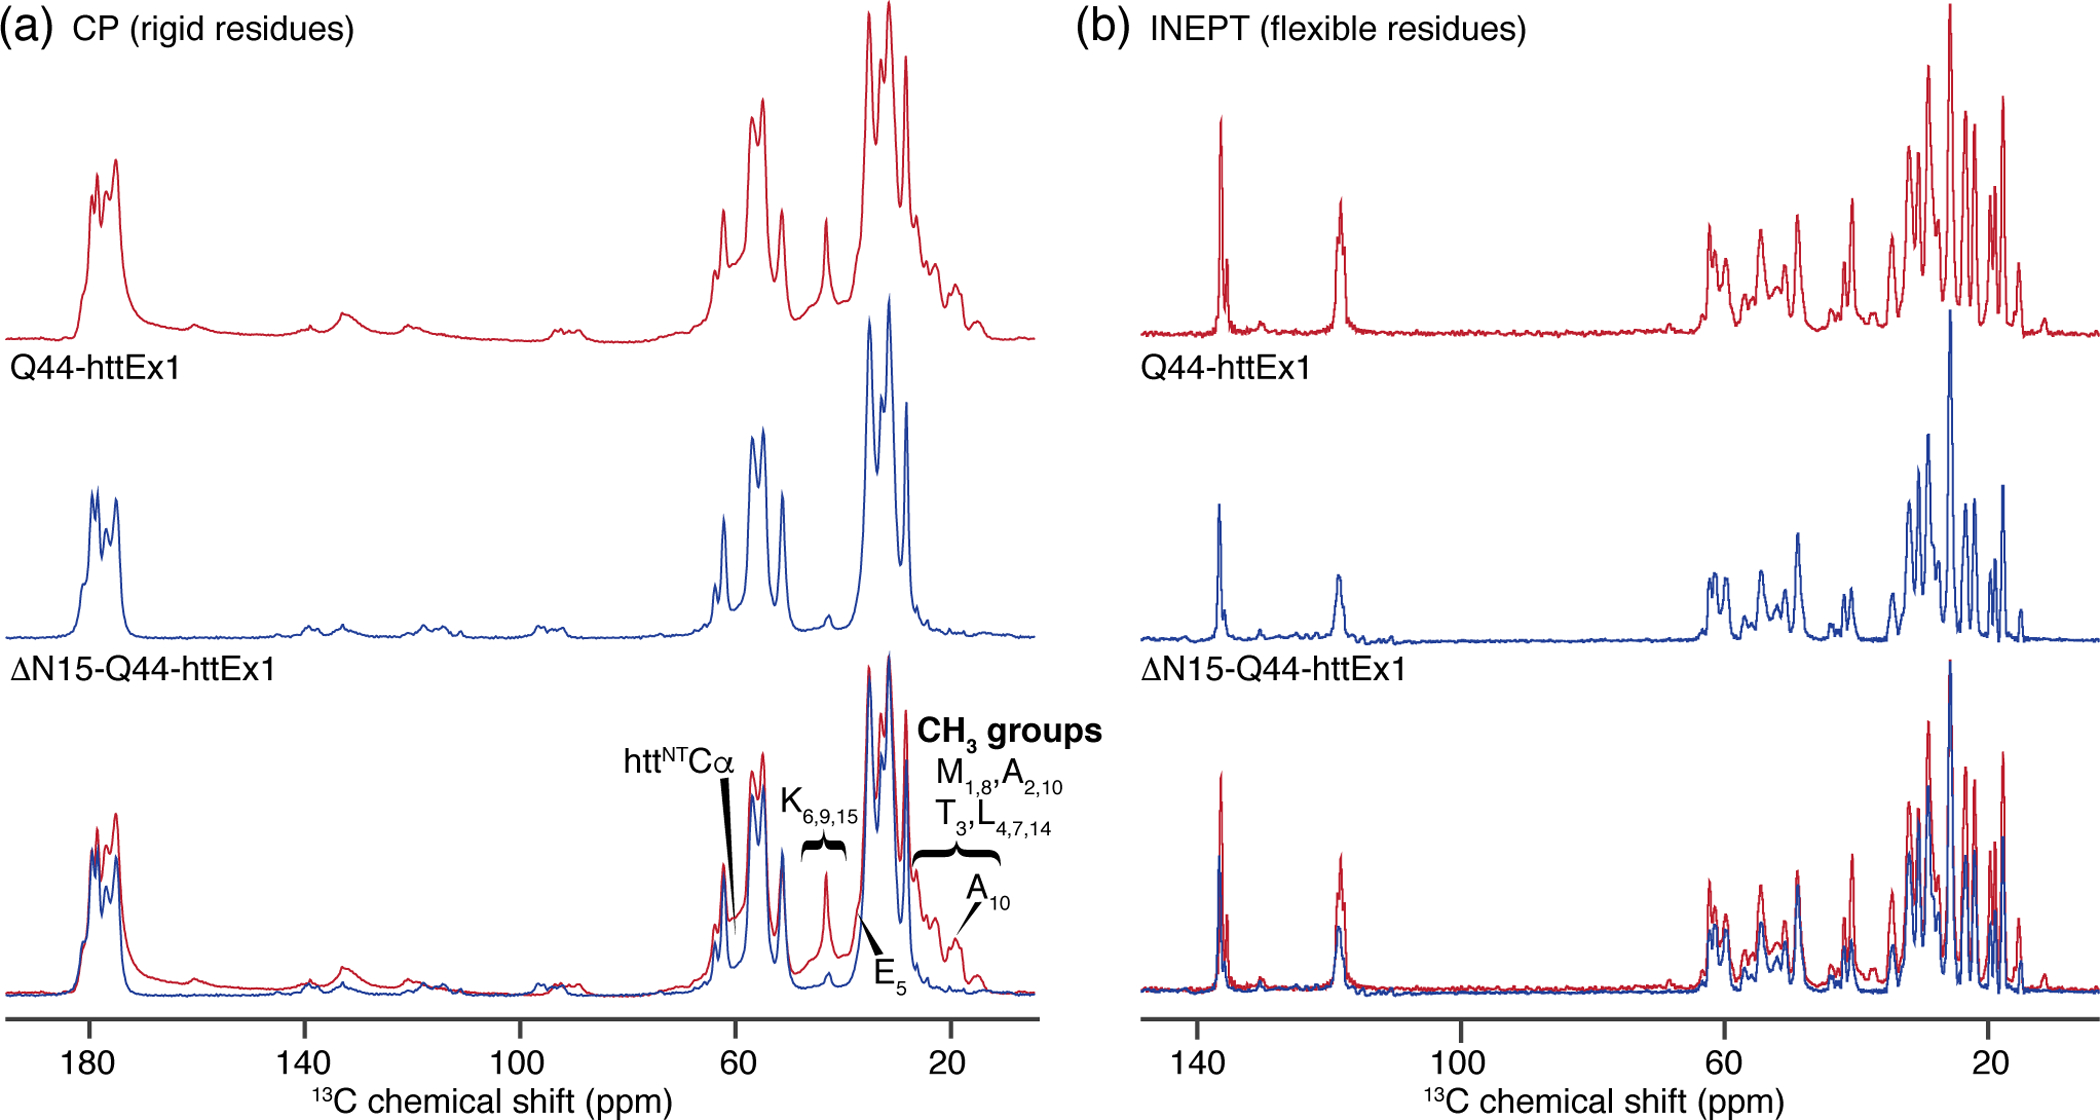
Fig. 5. MAS SSNMR comparison of ΔN15-Q44-HttEx1 and Q44-HttEx1 fibrils.

(a) Top: 1D cross polarization (CP) 13C spectrum of Q44-HttEx1 [36] and (middle) ΔN15-Q44-HttEx1, and (bottom) their overlaid comparison, normalized to the peak maxima for Q44-HttEx1. Spectral differences are consistent with the absence in the latter sample of the partly immobilized httNT seen in HttEx1 fibrils. (b) From top to bottom: 13C INEPT of Q44-HttEx1, ΔN15-Q44-HttEx1, and overlaid. The CP spectra feature signals from rigid and partly immobilized parts of the structure, while the INEPT data show only highly flexible residues. The spectra of Q44-HttEx1 are reprinted with permission from Lin et al. (2017) Nature Communications [36].
