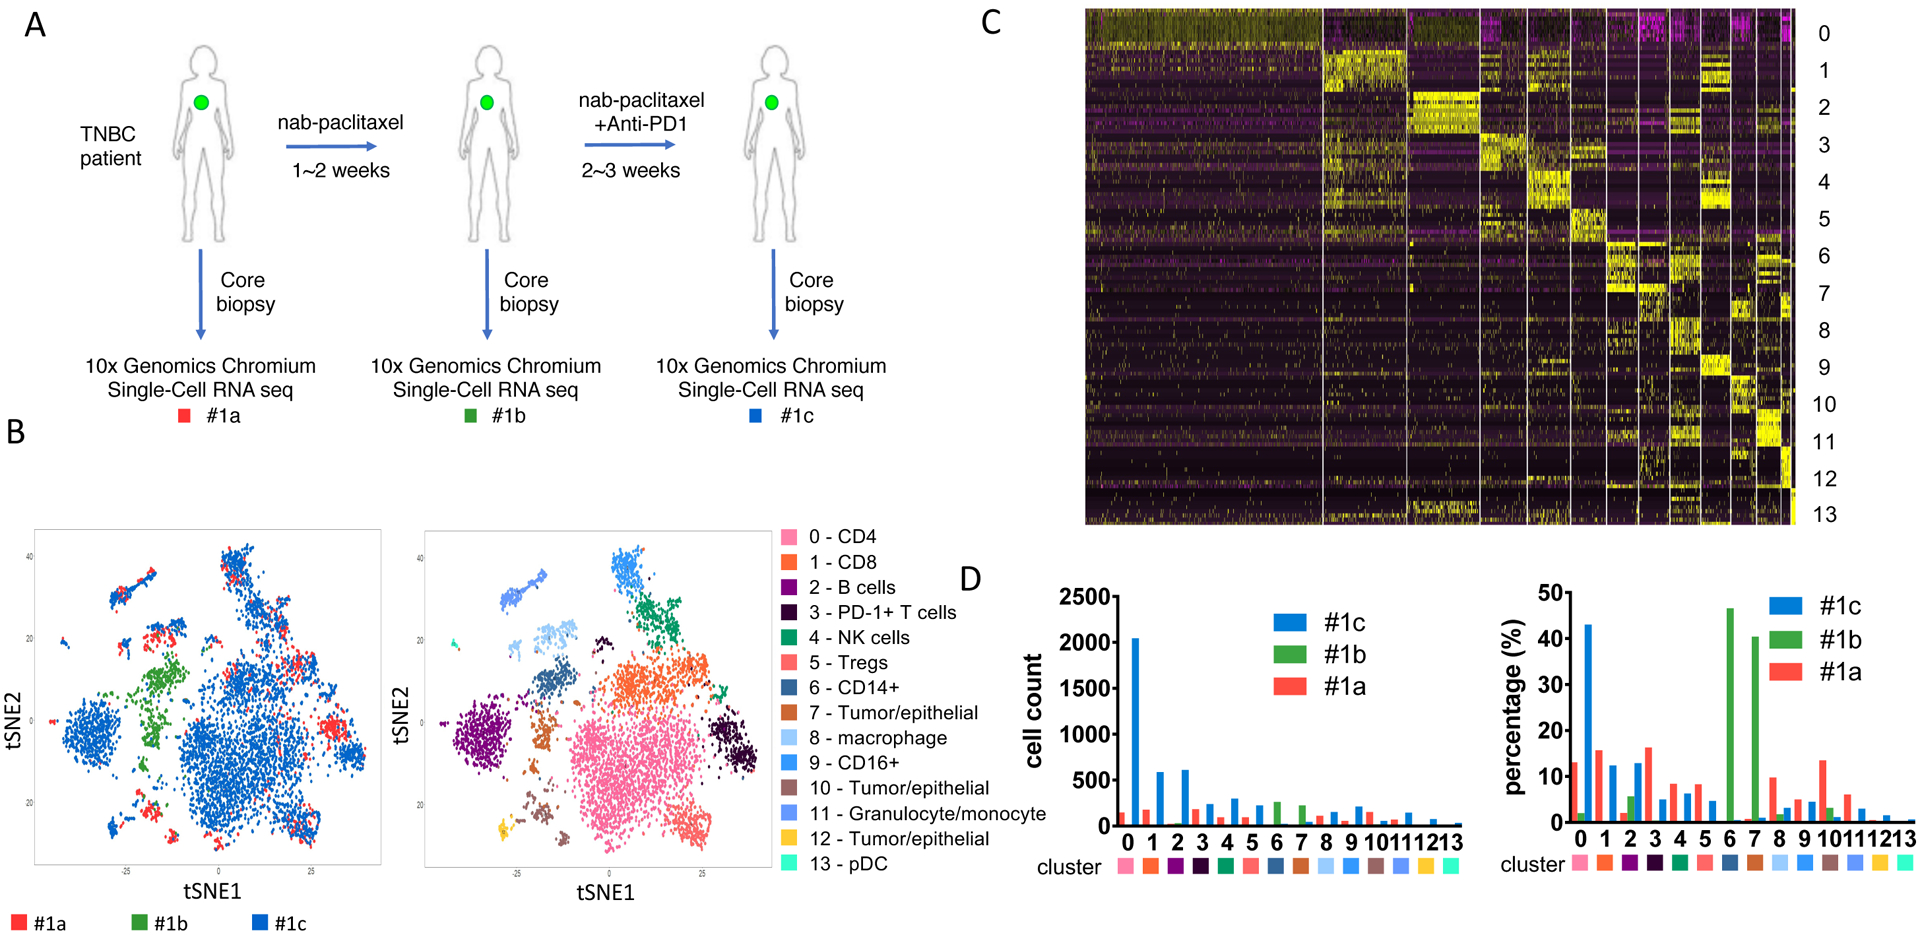
Figure 1. Single-cell RNAseq (scRNAseq) from a responder TNBC patient (patient #1) undergo chemo-immunotherapy.

(A) Diagram of the core-biopsy samples collected from patient #1 during nab-paclitaxel and pembrolizumab (anti-PD1) treatment. Red, #1a, sample collected before treatment; green, #1b, sample collected after 1 cycle of nab-paclitaxel; blue, #1c, sample collected after treatment of nab-paclitaxel and pembrolizumab. (B) t-SNE analysis of the combined scRNAseq samples showed in panel A. Left panel, t-SNE plot of clustered cells overlayed with different color representing each TNBC patient biopsy. Right panel, clustering of different tumor or immune subpopulation with different color. (C) Heatmap of top differentially expressed (DE) genes from each cluster showed in panel B. (D) Cell number corresponding to each cluster from individual samples. Left panel, absolute cell count. Right panel, percentage of each population among each biopsy collected.
