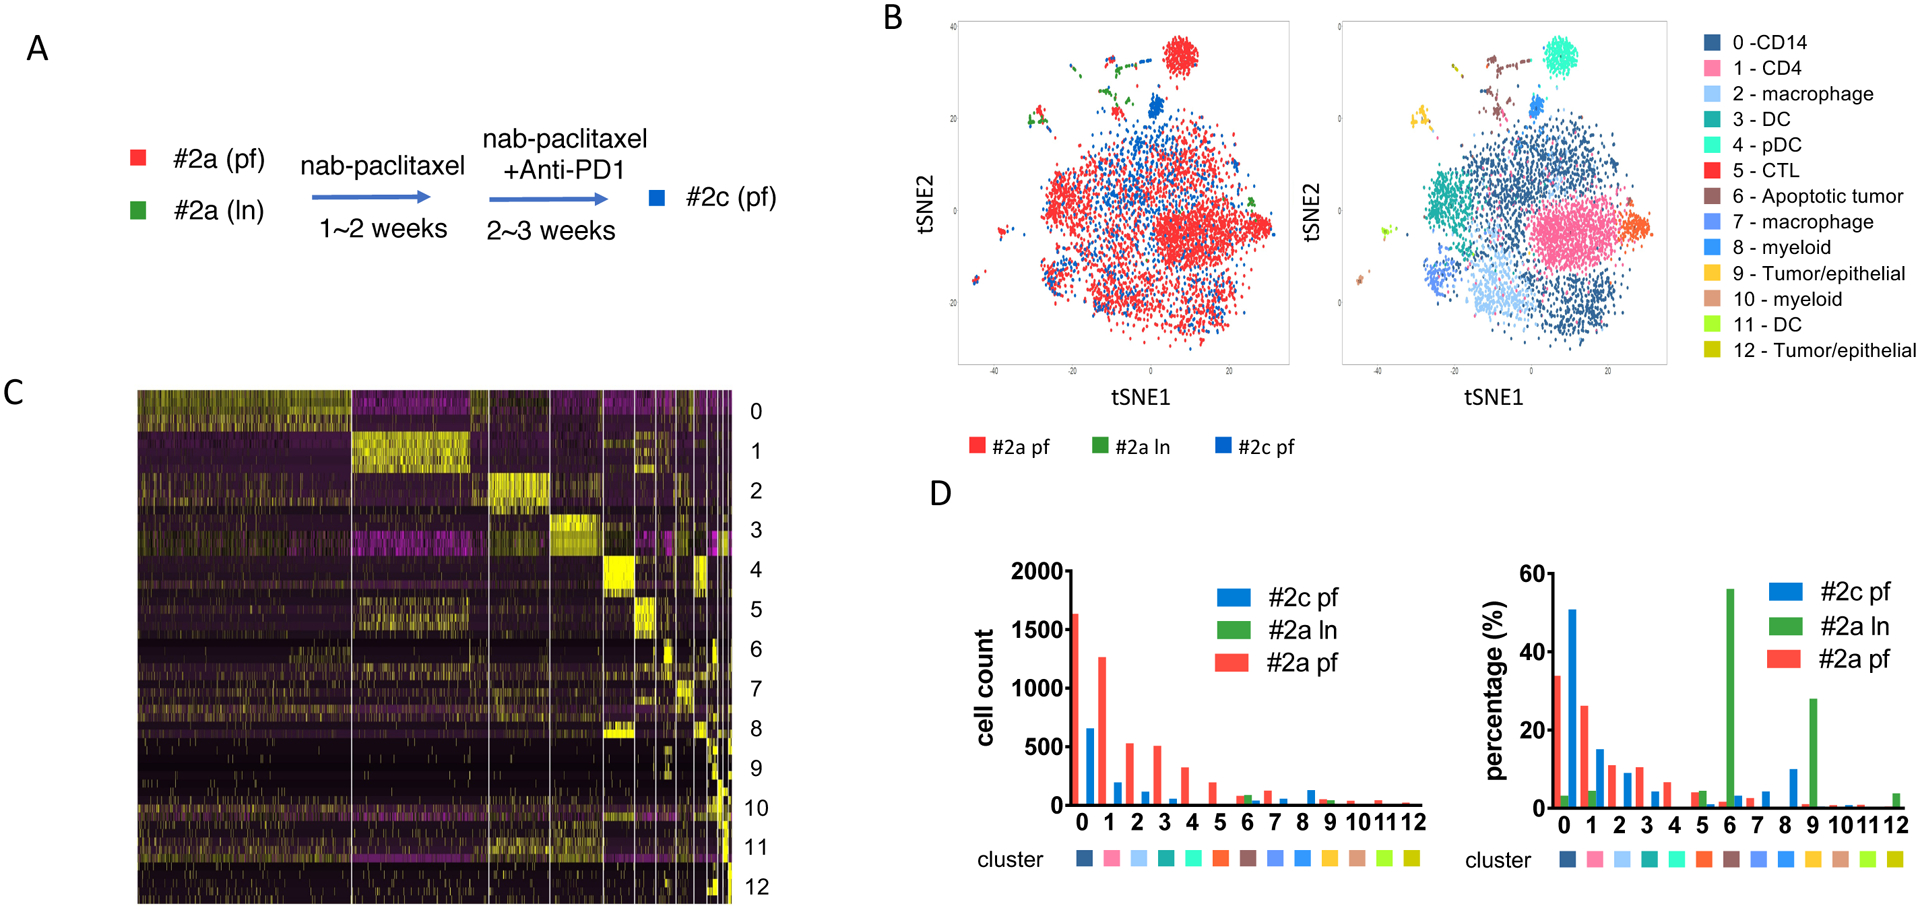
Figure 2. Persistent myeloid subpopulations from a metastatic TNBC patient progressed after chemo-immunotherapy.

(A) Sample collection diagram from patient #2 before and after nab-paclitaxel and pembrolizumab (anti-PD1) treatment. Pleural fluid (PF) (#2a pf, red) and lymph node (LN) (#2a ln, green) samples collected before treatment; pleura fluid (#2c pf, blue) collected after treatment of nab-paclitaxel and pembrolizumab. (B) Immune infiltrates annotation shown as t-SNE plot of the combined samples collected from patient #2. The spatial location between each cell was calculated by principal component directions of most variable genes and visualized by t-SNE plot. Left panel, each dot represents one cell from each group. Red, #2a pf; green, #2a ln; blue, #2c pf. Right panel, annotation of total 13 clusters of cell populations from patient #2 biospies. Each subpopulation of cells visualized using tSNE plot and specific DE genes. (C) Heatmap of expression levels of top differentially expressed (DE) genes within each cell analyzed within each cluster identified corresponding to panel. (D) Cell number counts for each cluster identified. Left panel, each column represents total cell count for each cluster. Right panel, distribution of each cluster cell numbers from each sample as percentage in total cells.
