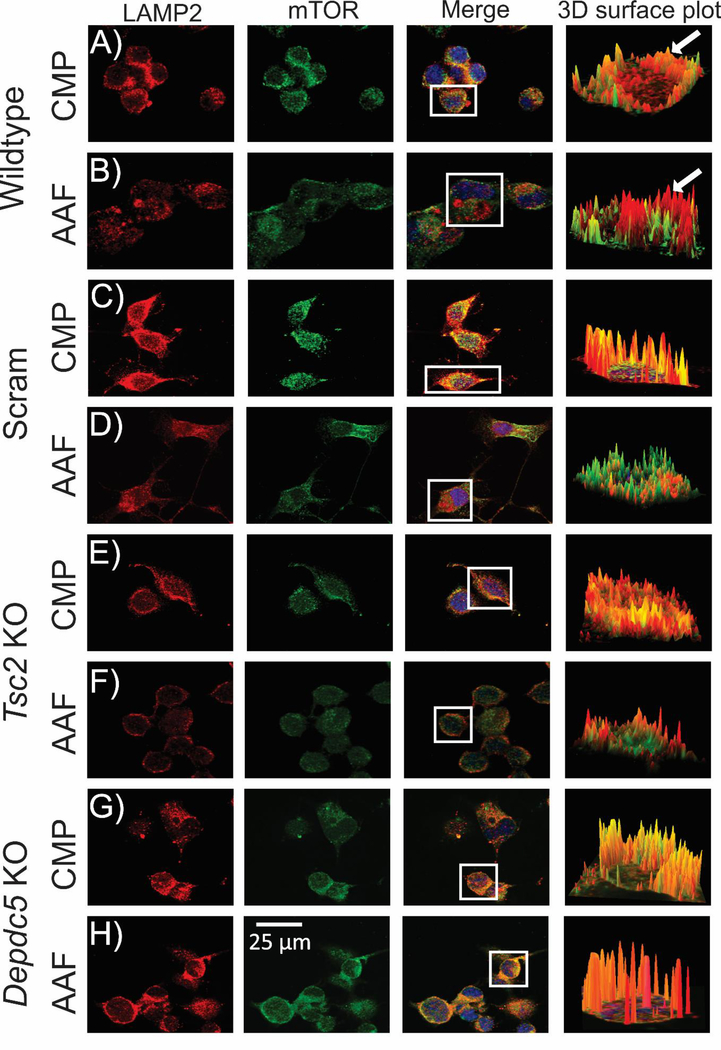
Figure 5: Reduced colocalization between mTOR and the lysosomal membrane in Tsc2 KO but not Depdc5 KO cells in AAF conditions.
WT, scramble, Tsc2 KO, and Depdc5 KO cell lines incubated in AAF media (60 minutes), fixed in 4% PFA and visualized with antibodies targeting mTOR (red; alexa 594) or LAMP2 (green; alexa 488) on a spinning disk confocal microscope. Regions of interest (ROIs; cell bodies) were selected in digital micrographs and 3D reconstructed (Image J; arrows). ROIs of mTOR and LAMP2 colocalization are orange or yellow (arrow, A) and ROIs where mTOR and LAMP2 are not colocalized appear as distinct red and green areas (arrow, B). After incubation in AAF media WT (B), scramble (D), and Tsc2 KO (F) cell lines display a decrease in colocalization between mTOR and the lysosomal membrane vs. incubation in complete media (A, C, E). However, no statistical difference in colocalization was observed in Depdc5 KO cell lines incubated in AAF media (H) vs. complete media (G). Statistical data for digital micrographs are in Fig. 6. High-definition videos showing 3D surface visualization of colocalization are provided (Movies S2–S9).

