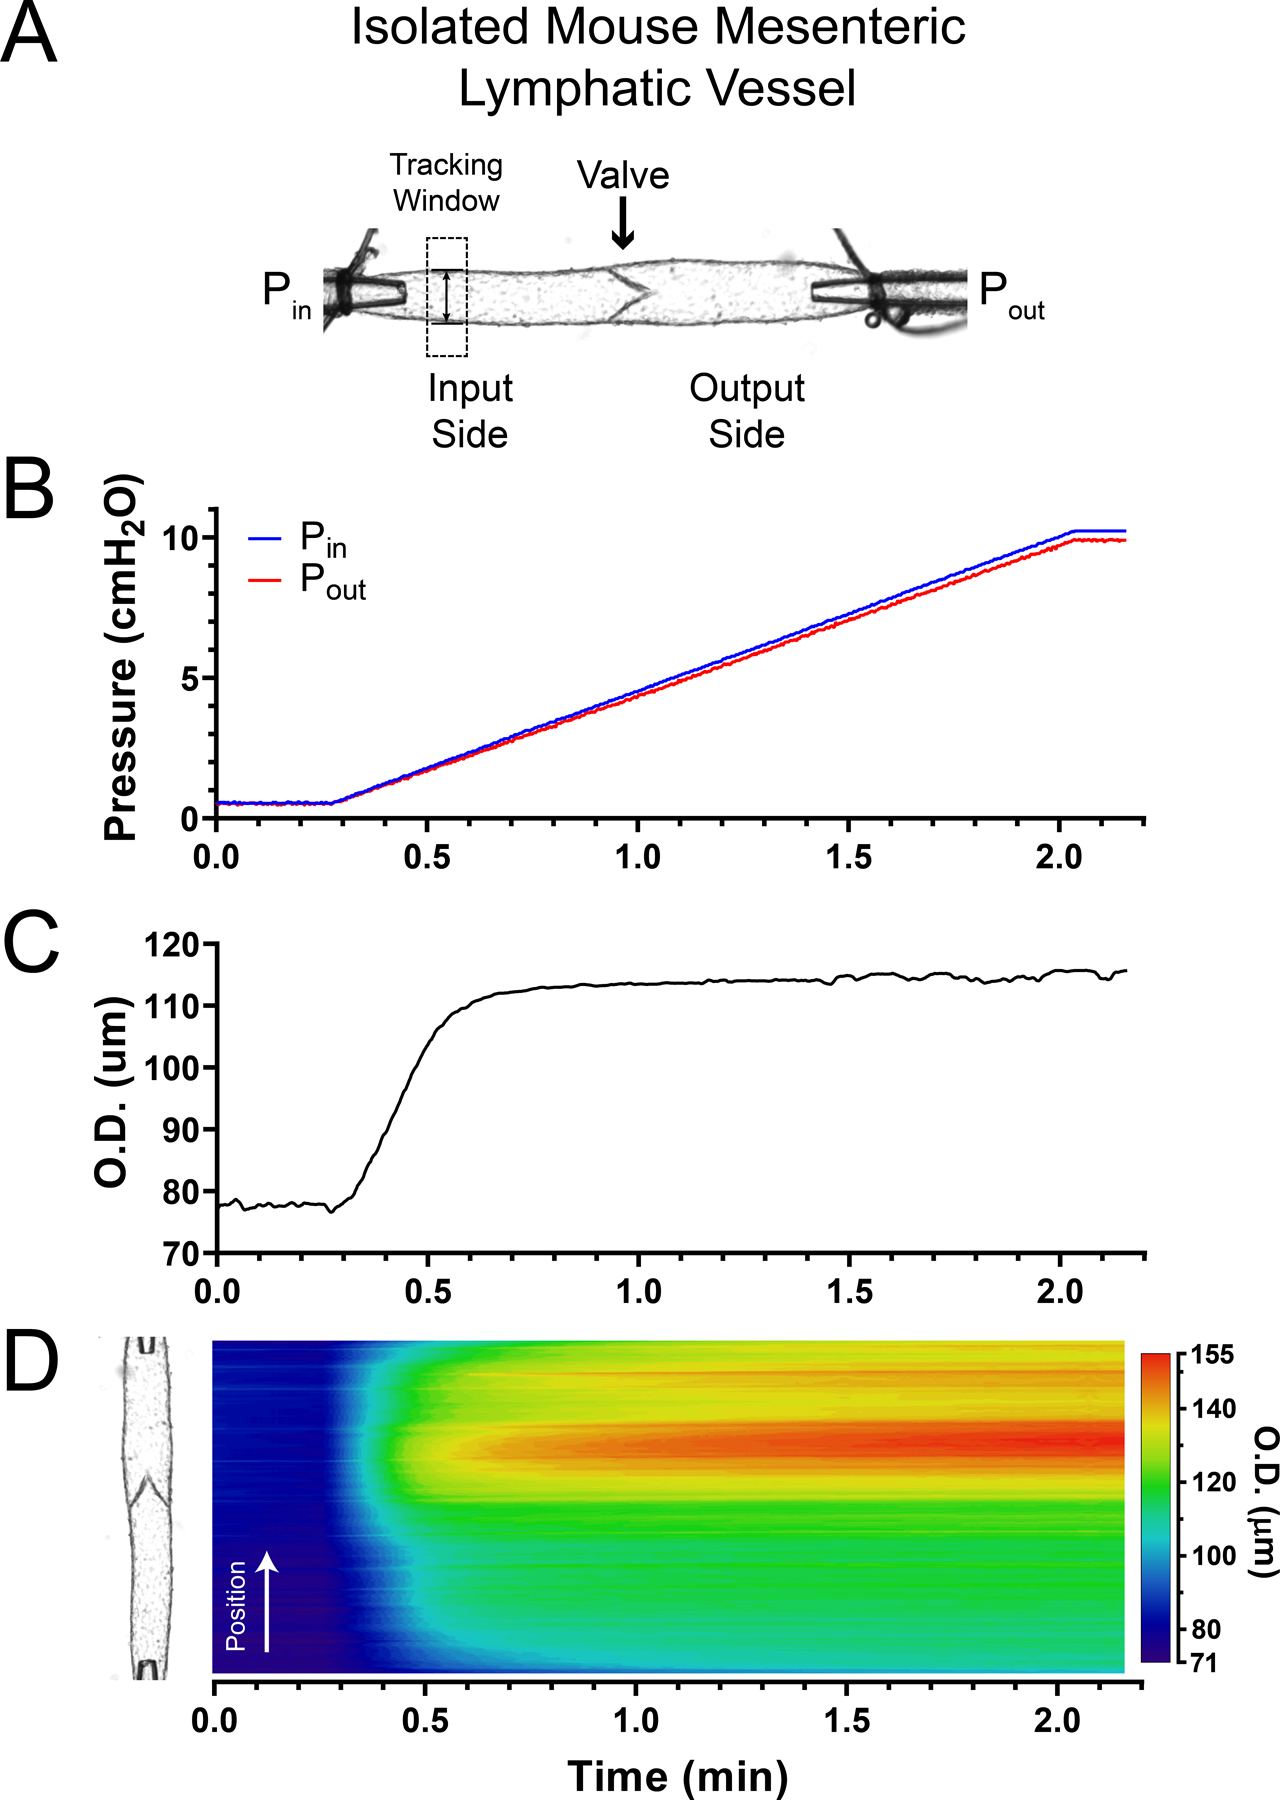
Figure 1. Pressure-driven changes in vessel diameter.

A, isolated, cannulated and pressurized single-valve mesenteric lymphatic vessel segment from the mouse with independent control of input and output pressures (i.e. Pin and Pout, respectively). B, double (i.e. input and output) pressure ramp traces. C, outside diameter (O.D.) as a function of pressure recorded from the single tracking window shown in the top panel. D, space time map (STM) generated from an outside diameter line scan showing the change in diameter as a function of time (horizontal axis) along the entire lymphatic segment (position is indicated on the vertical axis and is aligned with the vessel image shown on the left side) as pressure increases in a ramp-wise manner (B). Outside diameter is encoded in a colour-scale as indicated to the right of the heat map. The time (horizontal) axis is matched in panels B–D. Vessel wall diameter changes are determined as a function of pressure by mapping the diameter values in C and D to the pressure ramp values in B.
