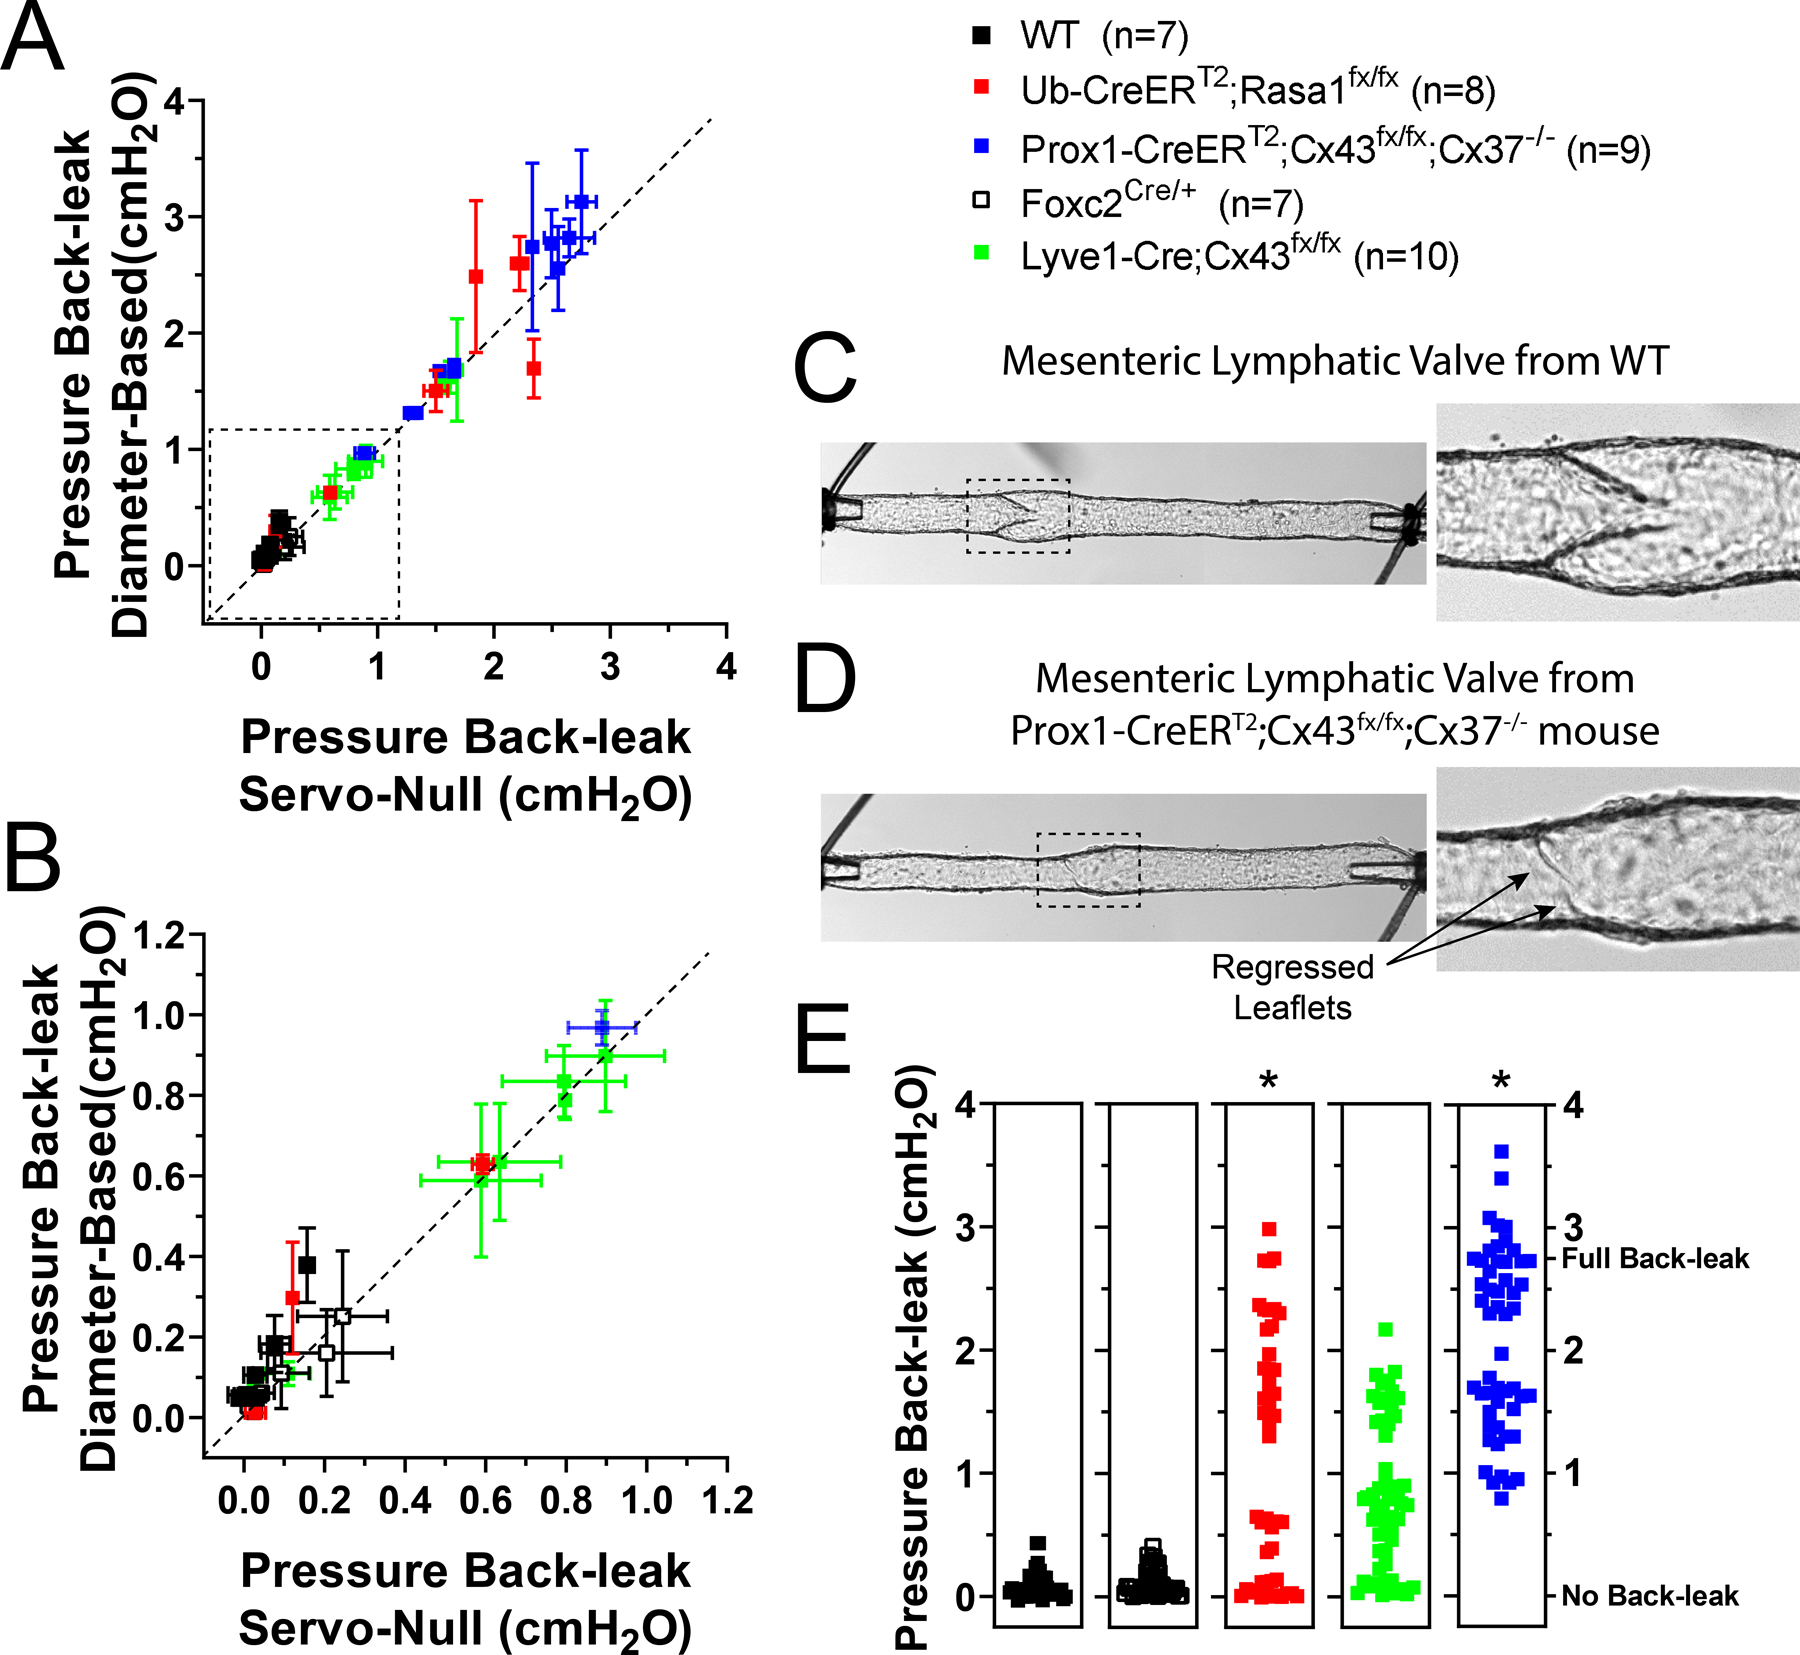
Figure 5. Assessment of pressure back-leak in mesenteric valves displaying various degrees of valve dysfunction.

The degree of pressure back-leak was determined in single valves from WT, Ub-CreERT2;Rasa1fx/fx, Foxc2Cre/+, Lyve1-Cre;Cx43fx/fx, or Prox1-CreERT2;Cx43fx/fx;Cx37−/− mice at 5cmH2O adverse (output) pressure. A, calculated pressure back-leak (measurement referenced to the initial input pressure of 0.5cmH2O) using the diameter-based method plotted as a function of the corresponding measured pressure back-leak from a servo-null micropressure recording. Dotted line represents the ideal one-to-one correlation (i.e. slope=1); servo-null and diameter-based method measurements are linearly correlated with a Pearson’s correlation coefficient r=0.9839, P<0.05. Values are reported as the mean±standard deviation of 9 repeated measurements that result from matching 3 back-leak tests with each of 3 calibration ramps. B, zoomed-in view of the dotted box shown in panel A (both normal valves and valves displaying a low-to-intermediate degree of dysfunction). Calculation of pressure back-leak using changes in outside diameter upstream from the valve gives accurate and precise values as evident from the corresponding servo-null micropressure measurements. C, representative image of a mesenteric lymphatic vessel from a WT mouse showing a fully formed, competent valve. D, representative image of a mesenteric lymphatic vessel from a Prox1-CreERT2;Cx43fx/fx;Cx37−/− mouse showing a severely defective valve where leaflets have almost completely regressed. E, pressure back-leak measurements per group, with all individual data points shown. ∗Statistical significance (P<0.5) when compared to WT controls using a two-way ANOVA test.
