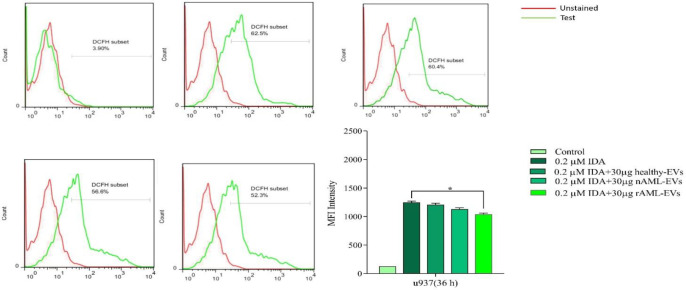
Figure 7.
U937 cells were treated with or without 30 µg of healthy, new case AML and relapsed AML-EVs, and assayed for ROS production by using the fluorescent dye DCFDA. Representative histograms showed ROS generation in each experimental condition. Graph represented the mean values ± SE of the MFI of DCF. Statistical significance were defined at *P < 0.05

